Posts indexed
Financial Social Intelligence.
Market accounts tracked
Stocks and market assets tracked
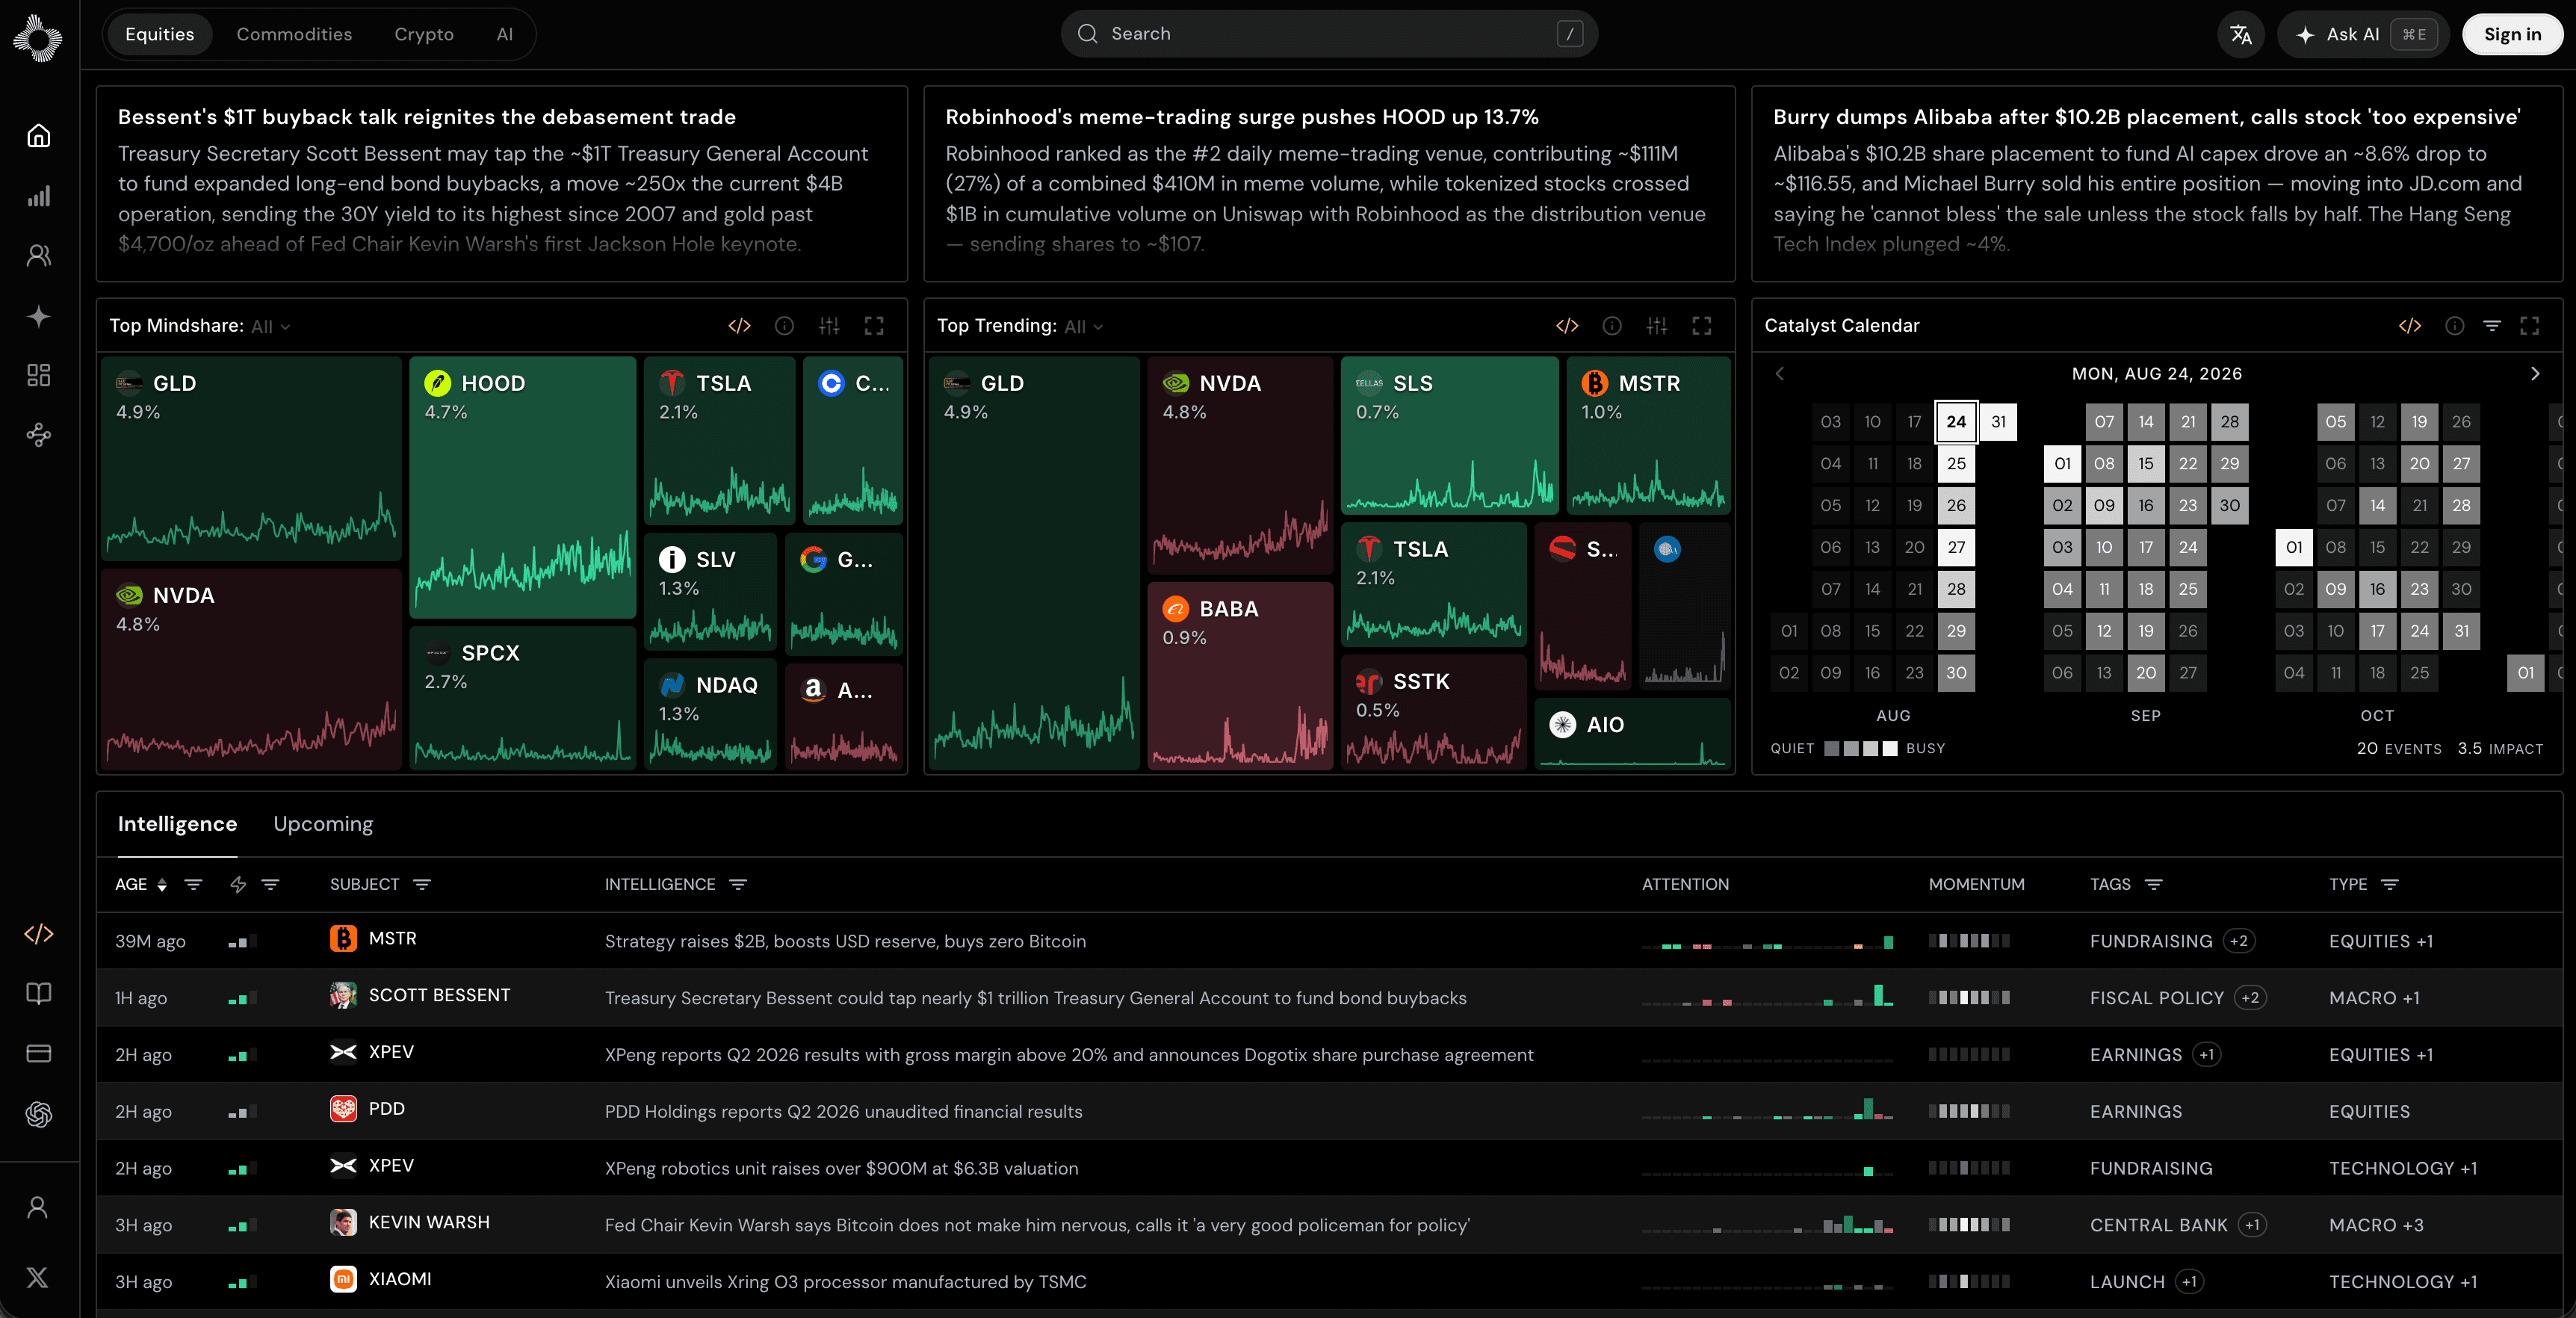
One dashboard for every thesis.
Build a watchlist around any stock or market theme. Bring market intelligence, discussion, sentiment shifts, upcoming catalysts, and your own notes into one view.
Ready-made or custom.
Start with complete pages for NVIDIA, Amazon, SpaceX, and more. Then build custom dashboards around your own process.
Social analytics
done differently.
Price LevelsSee which prices the market is actually arguing about, mapped against where it traded.
 NVDA Price Interest
0 posts4,286 posts

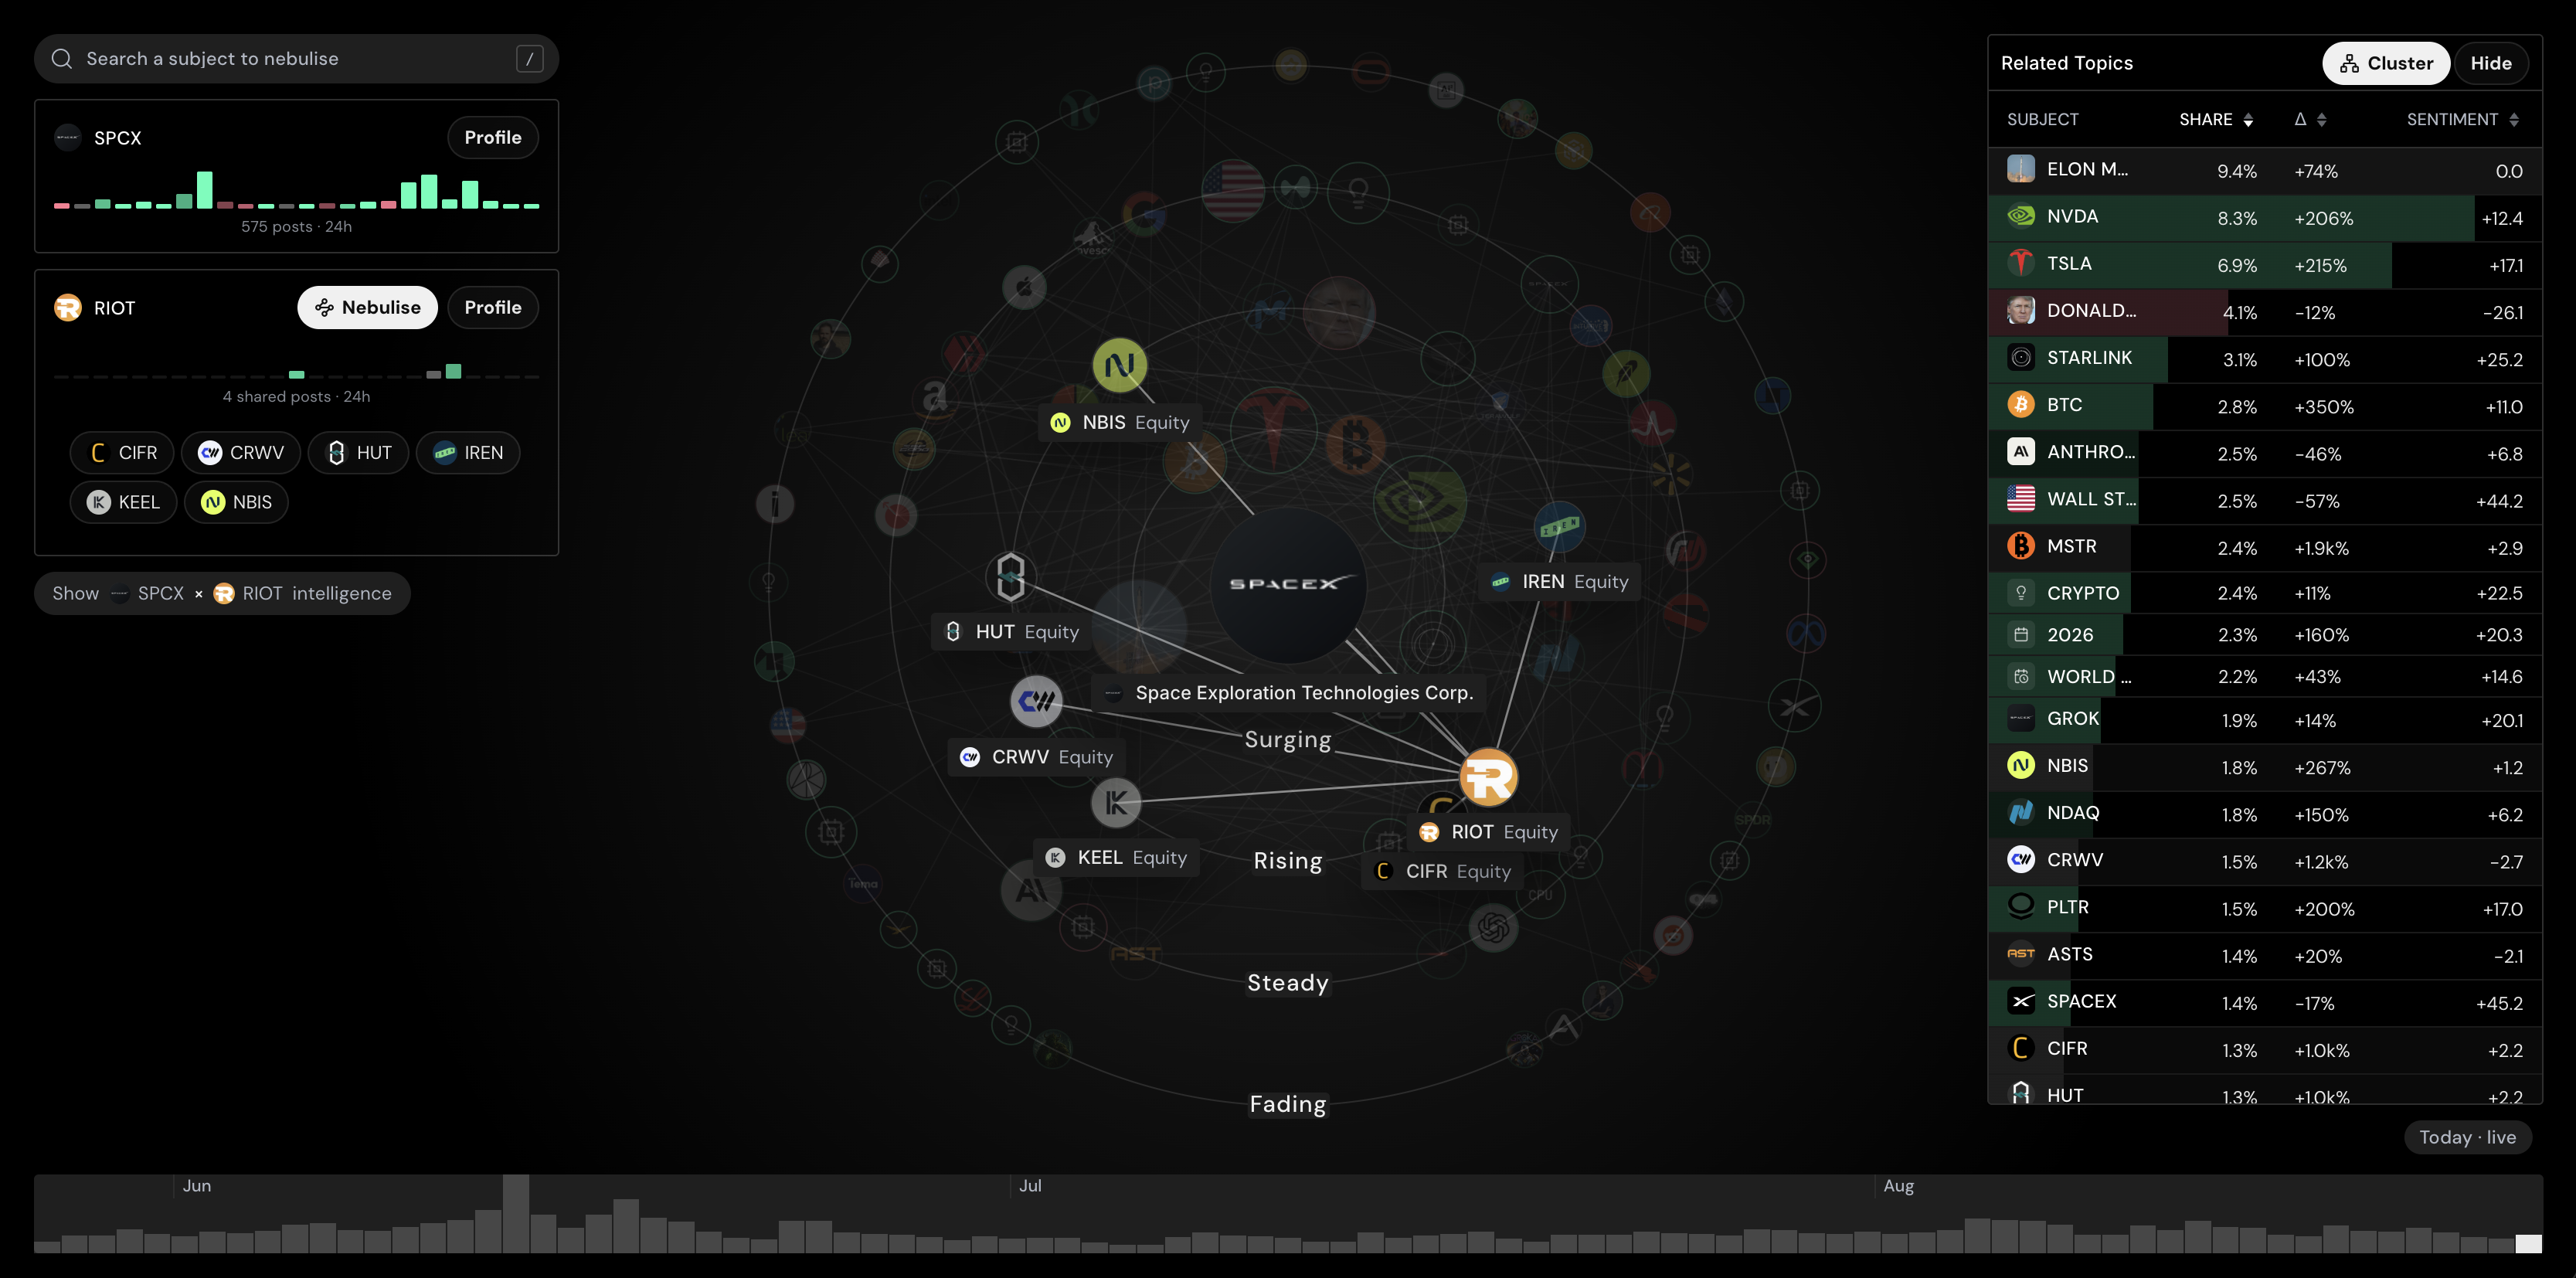
Watch narratives take shape.
Orion maps every stock as a network of actors, related markets, and ideas—showing what is surging, rising, steady, or fading.
Build with live market intelligence.
Access Nebula's sentiment, attention, narratives, and market-actor data through a clean REST API. Power dashboards, trading systems, and agents.
src/market-intelligence.ts
01const params = new URLSearchParams({02 asset_id: 'NVDA',03 hours: '24',04});05 06const sentiment = await get(07 '/sentiment',08 params,09);10 11return {12 symbol: 'NVDA',13 sentiment: sentiment.series.at(-1),14};01const params = new URLSearchParams({02 asset_id: 'NVDA',03 asset_class: 'equity',04 hours: '168',05});06 07const [sentiment, mindshare] = await Promise.all([08 get('/sentiment', params),09 get('/mindshare', params),10]);11 12return {13 symbol: 'NVDA',14 sentiment: sentiment.series.at(-1),15 mindshare: mindshare.series.at(-1),16};One API.Every market signal.
Build with sentiment, mindshare, narratives, and market actors. Use an API key, or pay for eligible reads from your wallet with x402. No Nebula account required for wallet payments.
- Stocks first
- Equity market intelligence
- One contract
- REST, MCP, and CLI
- x402 payments
- Pay per request with USDC on Base
import os import httpx API_URL = ( "https://nebula-api.hiddensystems.ai")API_KEY = os.environ["NEBULA_API_KEY"] async def get_assets() -> dict: async with httpx.AsyncClient( base_url=API_URL, ) as client: response = await client.get( "/api/v1/public/assets", params={ "query": "NVDA", "asset_class": "equity", }, headers={"X-API-Key": API_KEY}, ) response.raise_for_status() return response.json()Live market intelligence.Inside every Agent.
Connect Nebula through MCP or CLI so your agents can work with live equity signals and source evidence.
Works withChatGPTClaudeCursorand more
nebula — ~/market-scan
>
Choose how to get started
Build on your own
Launch your market-intelligence product with:
- Live market intelligence in the Nebula app
- API, MCP, and CLI access
- Usage-based plans that scale
- Comprehensive documentation and guides
Get extra support
Custom limits and hands-on support for your team.
- Dedicated onboarding support
- Custom rate limits
- Custom endpoint and data access
- Commercial terms and invoicing
- Early access to new capabilities
Changelog
The Intelligence table now follows storiesEvery development in the Intelligence table now shows the story it belongs to, so you can follow how news about NVIDIA, Amazon or SpaceX unfolds without leaving the table.Home now screens the marketThe table on Home is now a screener: every asset in the selected market, ranked by attention, with its price, mindshare, news, conversation, communities, sentiment and mindshare forecast on one row.Prediction markets in NebulaExplore Polymarket and Kalshi contracts alongside the existing intelligence about their subjects.Home now opens on the top stories, across every subjectThe new Home ranks the stories the world is talking about right now, from NVIDIA and Amazon to SpaceX, politics and sport, and shows how each one developed.
Frequently Asked Questions
Clear answers about the data, methodology, coverage, and API.
Read the documentationFinancial social intelligence measures how investors, analysts, executives, institutions, and the wider market are talking about an asset or theme. Nebula reads relevant social posts with large language models rather than simply counting keywords, then distils them into structured signals including sentiment, mindshare, emotion, social momentum, and market conviction.
Nebula continuously ingests social and market conversation alongside financial news, scores each item with proprietary machine-learning models, and rolls the results into live indices for individual assets and market themes. Because scoring happens as content arrives, you can see sentiment change around earnings, guidance, policy decisions, listings, market moves, and breaking news in near real time.
Nebula is stocks-first and analyses financial conversation across equities, AI, commodities, indices, sectors, and broader market themes. Public stocks remain equities, private AI businesses remain subjects, and commodities and benchmarks retain their own identities, while each can use the relevant sentiment, mindshare, emotion, audience, and cohort-level signals.
Yes. Nebula’s AI market view combines public AI stocks such as NVIDIA with private AI businesses such as OpenAI and Anthropic without changing what each subject is. You can compare sentiment, mindshare, trending activity, and narratives across the curated AI universe, then open an equity page for a listed stock or a subject page for a private business.
Yes. Nebula can organise and analyse conversation about commodities such as gold, oil, natural gas, copper, and agricultural markets. Commodity sentiment should be read with mindshare, post volume, author cohorts, narratives, and independent market data; linked funds or producers can be compared separately rather than being treated as the commodity itself.
Yes. Nebula can track indices such as the S&P 500 as market benchmarks and compare their conversation with linked instruments and constituent stocks. Index sentiment is most useful when combined with breadth, major constituent sentiment, volatility, mindshare, and the narratives driving the aggregate.
Yes, as audience groups. Nebula groups the participants in each conversation into cohorts such as investors, analysts, executives, and market commentators, so you can compare how bullish or bearish each group is, which assets and themes it is discussing, and how its view changes over time.
Nebula applies proprietary machine-learning and large language models to every post it ingests. Instead of relying on keyword matching, the models interpret meaning, tone, sarcasm, conviction, and market context, then output structured signals such as sentiment, emotion, significance, and community conviction. This turns unstructured market conversation into clean, machine-readable data.
Nebula brings together social and market conversation with financial news. Every relevant post, thread, video, and headline is scored by Nebula’s models and organised by stock, asset, theme, event, and author cohort, so the signals reflect the wider live conversation rather than a single feed.
Yes. Every post Nebula ingests is tagged by topic and event, including earnings, guidance, analyst actions, mergers and acquisitions, IPOs, regulation, macroeconomic releases, technical analysis, listings, exploits, rumours, and breaking-news catalysts. Those tags shape Nebula’s intelligence for each stock, asset, sentiment reading, cohort, and time window.
Yes. Nebula classifies the participants behind the conversation into audience groups, so you can separate who is talking from what is being said. You can isolate investors, analysts, executives, founders, developers, institutions, media, or active traders, then use the same audience filters in the app or through the API.
Social Momentum shows post volume over time broken down by the author groups driving the conversation. It matters because who is talking can be more revealing than raw volume: attention limited to retail traders looks very different from a theme spreading among analysts, institutions, executives, and long-horizon investors. Nebula makes that change in participation visible.
Nebula classifies millions of accounts into detailed groups spanning executives and leadership, builders, capital and institutions, influence and media, research and analysis, active traders, policy voices, and automated accounts. It also derives high-signal groups from observed track record, allowing you to compare professional, institutional, retail, and specialist perspectives on the same market.
Yes. Nebula computes sentiment, mindshare, and post volume for individual author groups and combinations of groups. You can isolate one audience, compare institutional and retail views, or build a custom cohort to see where market opinion is converging or diverging. The same cohort-level readings are available through the API.
Yes. Nebula exposes its sentiment signals, indices, and social metrics through an API so quantitative teams can pull the same data that powers the app into their own stack. This supports sentiment-driven strategies, historical analysis, backtesting, monitoring, and real-time model inputs across supported markets.
Yes. Nebula is designed for machines as well as people. Structured signals are available through the API, MCP, and CLI, allowing autonomous systems to query live sentiment, mindshare, emotion, and cohort positioning. Nebula also includes an in-app intelligence agent for exploring the data conversationally.
The Conviction Index measures unusually strong, identity-driven conviction around a stock or asset. It reads persistent belief in the language people use, including conviction that survives drawdowns or becomes detached from price. The signal can help identify unusually resilient communities across equities and other attention-driven markets.
Yes. Nebula derives high-signal groups from participants with a strong history of early or correct market views, so you can compare their aggregate bullish and bearish positioning on an asset with the wider market.
Nebula surfaces fifteen distinct emotions, organised as opposite pairs: joy and sadness, optimism and pessimism, trust and distrust, confidence and fear, anticipation and boredom, love and disgust, and greed and anger, plus surprise. This helps distinguish genuine conviction from uncertainty, capitulation, short-lived euphoria, or crowded enthusiasm.
Most sentiment tools count mentions or apply basic positive-versus-negative labels. Nebula reads every relevant post with large language models and produces deeper proprietary signals including asset-level fear and greed, social momentum, community conviction, emotional breakdown, mindshare, and high-signal cohort positioning.
Nebula provides metrics across stocks, equities, sectors, and market themes, with more than 100,000 assets and subjects already indexed. Coverage follows the conversation: when a stock, asset, or theme attracts meaningful attention, Nebula can organise and analyse the surrounding market discussion.
Mindshare is the share of overall market conversation commanded by a stock, asset, or theme. Nebula measures how much relevant discussion is dedicated to it relative to the wider tracked market, allowing you to see attention rotate between sectors, narratives, and assets before that change is necessarily reflected in price.
Social volume measures how much people are talking about something, while sentiment measures how they feel about it. Nebula tracks both over time, helping distinguish quiet conviction from a loud, crowded trade and revealing when attention is accelerating while opinion is strengthening or deteriorating.
Nebula retains historical sentiment, fear and greed, mindshare, social momentum, and other signals so you can chart how an asset’s social picture has evolved. Historical data helps teams compare current readings with previous market regimes and backtest sentiment-driven strategies.
Extreme social readings can provide useful context around market turning points. Euphoria and crowded optimism can accompany local tops, while fear and capitulation can appear near bottoms. Nebula makes these conditions visible per asset so they can be considered alongside price, fundamentals, and other market data rather than used in isolation.
Yes. Nebula tracks the audience of relevant stock, asset, and market accounts over time. Follower growth sits alongside sentiment and mindshare to show whether attention is expanding, stagnating, or being driven by a short-lived event.
Yes. Asset-level fear and greed readings are available through the API, allowing you to display a live gauge or use the signal in a dashboard, model, bot, alerting system, or autonomous agent for any covered asset.
You can explore Nebula’s live intelligence in the app or pull the same structured data into your own stack through the API, MCP, or CLI. The Nebula documentation provides endpoint references and integration details for developers, quantitative teams, and autonomous systems.
Yes. Compatible HTTP clients and agents can use x402 to pay for eligible read-only API requests with USDC on Base. No Nebula account or API key is required for those requests. Your wallet signs a payment after checking the price, network, and recipient. Standard API, MCP, and CLI access continue to use Nebula account authentication and credits. See the x402 Payments section of the REST API documentation for instructions.