The terminology behind Hidden Systems. Explore the language of stocks, market intelligence, and research, alongside the signals and tools in our products.
Nebula
The platform, its research surfaces, and how they fit together.
Nebula
Nebula is a market-intelligence platform for researching stocks and the public conversation around them. It brings together attention, sentiment, emotions, market context, extracted calls, intelligence, and the people or groups driving discussion. Start with NVIDIA or Amazon in Search, examine its profile, and compare signals before drawing a conclusion. Nebula also supports broader global-market and subject research. It is a research interface, not a brokerage: a bullish post, extracted call, or generated answer does not place an order or disclose an investor’s actual holdings.
Getting Started
Start on Home to see which stocks attract attention, then search a ticker such as NVDA and open its profile. Use Overview for context, Sentiment for conversation signals, and Performance for calls and outcomes where available. Set a timeframe, inspect the underlying posts or intelligence, and compare relevant clusters. Ask Nebula can explain the page and supported metrics. A custom dashboard collects the views you revisit. Missing price or call history does not mean a subject has no conversation; coverage differs by instrument and feature.
Home and Screeners
Home brings together market attention, intelligence, and research views. Its Sentiment Forecast tile shows where sentiment is likely to go over the next 24 or 72 hours for three assets picked by a Trending, Bullish or Bearish list; see Sentiment Forecast. A screener is a sortable, filterable collection of stocks or subjects, not a recommended portfolio. Mindshare sorts by attention share; a change column measures movement in that share, and sentiment describes the conversation’s stance. Check the selected market, timeframe, sort column, and filters before comparing rows. A high rank in one view need not imply a high rank in another, and a narrow filter can exclude otherwise active stocks.
Clusters Page
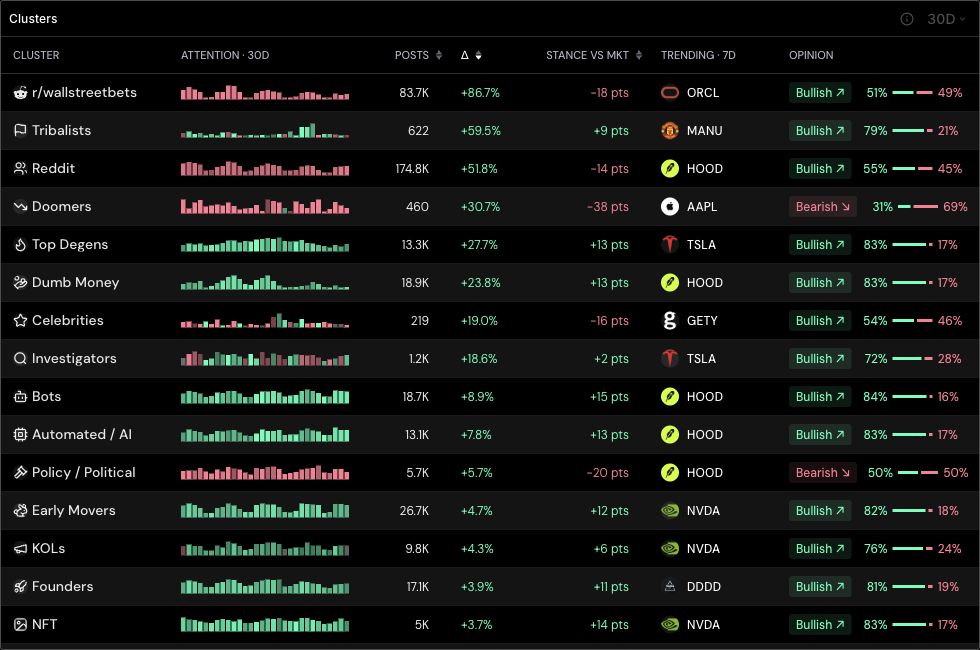
The clusters page compares every author cluster, caller-ranking segment and posting community side by side, and is the index to each cluster’s own page. Its table lists each group’s posts over the chosen window and their change against the window before, daily attention bars, Stance vs Market, the name it turned to more than the market did over the last 7 days (its rise in share of the group’s posts, less its rise in share of the market’s), and its bullish/bearish split; select a row to open that cluster. Around the table, the page reads the cluster page’s analyses across every group at once: the highest and lowest cluster on each profile trait, recent hype cycles with the order clusters arrived in, attention timing, and the most divisive assets. An asset-class selector in the search bar scopes every view to any mix of equities, commodities, indices and crypto. Figures come from complete UTC days, so the newest day appears once it has finished. Groups overlap, and rankings describe tracked discussion, not holdings, skill or future returns.
The Clusters page compares groups across the same market and window. Shown here: equities, 30D. Captured on 17 September 2026.
Search resolves stocks, tickers, people, organisations, topics, and other supported subjects to their Nebula profiles. Enter a name or symbol and choose the result whose identity and market match your intent; a name can refer to both a tradable instrument and a broader topic. Search can be opened from the main interface, with smaller search controls available inside workflows. A result’s presence establishes a tracked identity, not complete price history, exchange access, or a guarantee that every metric is populated.
Assets and Subjects
An asset is a market instrument with a specific identity and asset class. A subject is a broader tracked entity, such as a person, account, organisation, concept, or topic. The distinction matters because analytics are scoped to the selected identity: NVIDIA stock and a topic about its products are different research targets. Names and tickers can collide, so select the resolved result rather than guessing an identifier. In the Developer API, asset_id requires asset_class; non-asset subject_id is used separately.
Asset Classes
Nebula distinguishes equity, commodity, index, and crypto market instruments. Stocks and ETFs use the equity category. Some commodity and index exposure is represented by a listed proxy instrument rather than a direct spot market or the underlying index itself. Read the instrument name, symbol, and returned class. Traditional-market aggregate views group stocks, commodities, and indices together, so an unscoped equity aggregate is not a commodity-only or index-only result. AI-related research can refer to market assets or non-asset topics; AI is not itself an asset class.
Stock Profiles
A stock profile brings together the selected instrument’s overview, intelligence, conversation metrics, and available call performance. Overview, Sentiment, and Performance are views over the same identity, with different research purposes. Page-level timeframe and overlay controls coordinate supported charts. Open the source posts when an aggregate changes sharply, and check whether a cluster or chart-specific filter is active. A profile is not a valuation model, and missing data should be assessed feature by feature rather than treated as a zero reading.
Private Stocks
Nebula can track conversation about private stocks and associated subjects, including SpaceX. Tracking an identity or topic does not imply that exchange-listed price history, a tradable ticker, or every market-derived metric exists. Search for the name and use the returned profile; where no market instrument resolves, a non-asset subject may provide relevant discussion. Sentiment, attention, and intelligence can still be useful without public trading data. The agent should explain missing market coverage rather than substitute an unrelated ticker or invent a price.
Topic Profiles
Topic profiles organise discussion around non-asset subjects such as an industry theme, technology, person, or market concept. They can show an AI overview, sentiment, attention, related subjects, and intelligence where data exists. They do not automatically carry price, trading volume, or a stock’s market-derived metrics. Topic Mindshare uses the relevant subject universe, so compare it with like-for-like topic data. Use Related Topics or the Nebuliser to inspect how a concept connects to stocks and other subjects in the tracked conversation.
Nebula metrics
What each signal measures, how to read it, and where its limits matter. Examples use stocks such as NVIDIA and Amazon.
Mindshare
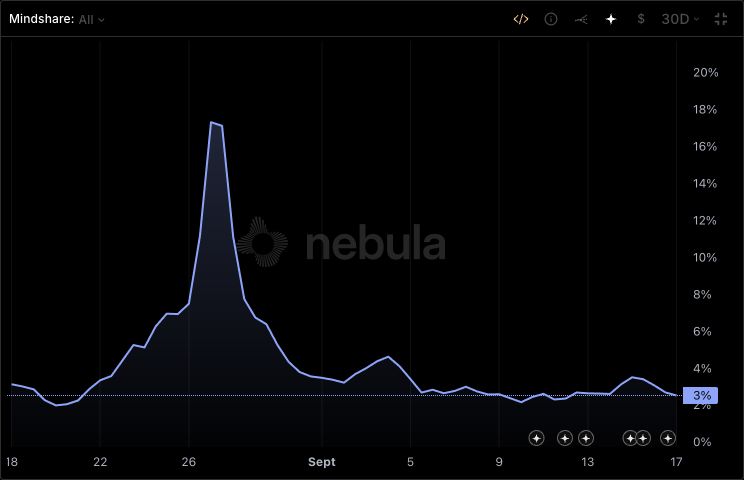
The share of tracked conversation about a stock or subject. At each hour, Nebula divides its non-bot posts over the trailing 24 hours by the relevant market’s non-bot posts over the same period. Stocks, commodities, and indices share the traditional-market denominator; people and topics use their own subject universe. A share of 0.05 means 5%: for example, 500 NVIDIA posts out of 10,000 relevant posts. With an author-cluster filter, both sides use the selected groups. Longer chart buckets use the ratio of average rolling counts. Mindshare measures attention, not approval, market share, ownership, or buying. It can rise because other stocks receive less attention.
NVIDIA’s Mindshare chart. The percentage axis shows its share of tracked conversation. Captured on 17 September 2026.
A 72-hour projection of a stock’s Mindshare, shown with the forecast toggle on the Mindshare chart and the overview chart’s Mindshare pane. It starts from the last completed 15 minutes, refreshes about every five minutes, and is drawn as a fan: faint simulated paths, a dashed median path, and a dotted likely range covering the middle 80% of outcomes (10th to 90th percentile). A header such as “Next 3 days 63% chance higher, likely 3.3–10.2%” gives the chance that Mindshare is above its current value in 72 hours and the likely range at that point. The column beside the chart shows where Mindshare is likely to land in three days; hovering the fan shows the median path, likely range and chance above now for that moment. A model trained on past moments predicts the expected level from recent posts at 15-minute and hourly detail, author-cluster activity and price moves; its spread comes from how similar past situations actually played out, including sudden attention spikes. In testing about 80% of outcomes landed inside the likely range, but sudden spikes from quiet stocks are the least predictable. It covers stocks and other assets with at least 30 non-bot posts in the last 30 days, recent posts and a recent price; otherwise the toggle is unavailable and says why. It forecasts all posts, so it is unavailable while an author-cluster filter is selected. It forecasts attention, not price, and is not a trading signal. Developers can list the assets that have a forecast and read the same forecast from the Developer API’s Forecasts operations; the forecast returns the distribution at every 4-hour step, 21 quantiles for binning, and 24 sample paths; an asset that cannot be forecast is answered with status not_forecastable and the reason rather than an error.
Social Sentiment
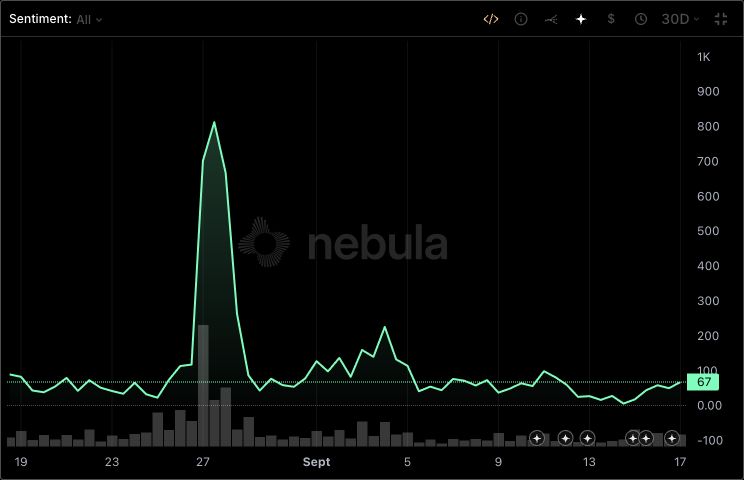
The bullish, bearish, or neutral stance expressed about a stock or subject. Nebula scores posts separately for each named asset from −100 to +100. Scores above +10 count as bullish, below −10 as bearish, and the rest as neutral. The sentiment chart shows decay-weighted bullish posts minus bearish posts over a rolling 24-hour window; a post 12 hours old counts half. Positive means net bullish conversation, negative means net bearish, and zero means balance or no directional contribution. This chart signal is unbounded and grows with post volume: it is not a percentage or the average post score. Compare a stock with its own history and check the post counts. The main unfiltered series excludes bots; separate cohorts and filters have their own scope.
NVIDIA’s Sentiment chart. The signal has its own numeric scale; it is not a percentage. Captured on 17 September 2026.
A 72-hour projection of a stock’s Social Sentiment signal: decay-weighted bullish posts minus bearish posts over the trailing 24 hours, a signed number that is above zero when the conversation is net bullish and below zero when it is net bearish. It is shown with the forecast toggle on the Sentiment chart and in the overview chart’s Sentiment pane, which opens with it drawn. It starts from the last completed 15 minutes, updates every 15 minutes, and continues the drawn line over a hatched future as a fan: faint simulated paths, a dashed median path, and a dotted likely range covering the middle 80% of outcomes (10th to 90th percentile), whose edges are green above zero and red below. The “where it lands” column of bars beside the chart gives the chance the signal ends in each range at the step hovered, or at 72 hours; hovering the fan shows the median path and likely range for that moment. The chance that sentiment ends higher than now is shown only when the model is confident, under 30% or over 70%: the header gives it for 72 hours, hovering gives it for the step pointed at, and the Home tile for +24h or +72h. Elsewhere the direction is close to a coin flip, so only the likely range is given. For example, a header reading “Next 3 days 76% chance higher, likely 40 to 180” on NVIDIA means a 76% chance that net bullish conversation about NVIDIA ends the three days above its current level, not that the price will rise. The forecast comes from the same simulated paths as the Mindshare Forecast: each path projects bullish, bearish and neutral posts in 4-hour steps, and the line is the sentiment signal those posts produce, so a simulated burst of posts appears in both fans. In testing about 80% of outcomes landed inside the likely range and confident chances were right about three times in four, but the range holds far less often in the day before a sudden surge of attention. It covers the same stocks and other assets as the Mindshare Forecast; otherwise the toggle is unavailable and says why. It forecasts all non-bot posts, so it is unavailable while an author-cluster filter is selected. On the Home page, the Sentiment Forecast tile shows three assets’ branching sentiment forecasts side by side at +24H or +72H: each row draws the signal over the same span as the horizon, then the fan from now, with the current value and where the median lands. A list picks them: Trending shows the most discussed names in the selected market; Bullish and Bearish show, among its 50 most discussed names, those the model is confident will end the horizon higher or lower, names already turning that way first. It forecasts conversation, not price, and is not a trading signal. Developers can read the same forecast from the Developer API’s Forecasts operations.
Fear & Greed
Nebula’s composite 0–100 gauge of market conditions around an instrument. Lower readings indicate fear and higher readings greed. The current model combines nine components: volatility, price momentum, trading volume, price position, social sentiment level and change, emotion level and change, and social-activity change. Components use different rolling horizons; selecting a seven-day chart does not turn the model into a seven-day calculation. Bands include their upper edge: 0–20 Extreme Fear, above 20–40 Fear, above 40–60 Neutral, above 60–80 Greed, and above 80–100 Extreme Greed. For example, 20 is Extreme Fear and 20.1 is Fear. It is neither a probability of a price rise nor an automatic buy or sell signal. Read coverage and price history alongside it.
The current model uses 14-day volatility against 30- and 90-day baselines, 30-day price momentum, 7-day versus 30-day trading volume, and price relative to its 180-day high and mean. Social and emotional levels compare 14 days with a 90-day baseline; changes compare 3 days with 14 days. Its component named mindshare measures 7-day versus 30-day post activity, signed by momentum; it is not the standalone Mindshare percentage. The weighted components undergo calibration, a smooth adjustment at the extreme-fear end, and bounding to 0–100. Missing social or emotion inputs can receive a neutral component value of 50, so a neutral contribution does not prove a balanced crowd. Sparse inputs and short histories can change interpretation.
Social Volume / Posts
The count of tracked posts mentioning a stock or subject in the stated interval. It is activity, not a count of investors, unique people, trades, or dollars. One author can publish several posts and one post can mention several assets. Use the source, bot policy, and interval shown by the relevant view; a raw bucket count differs from a rolling 24-hour total. More posts do not by themselves mean more bullish sentiment.
Social Momentum
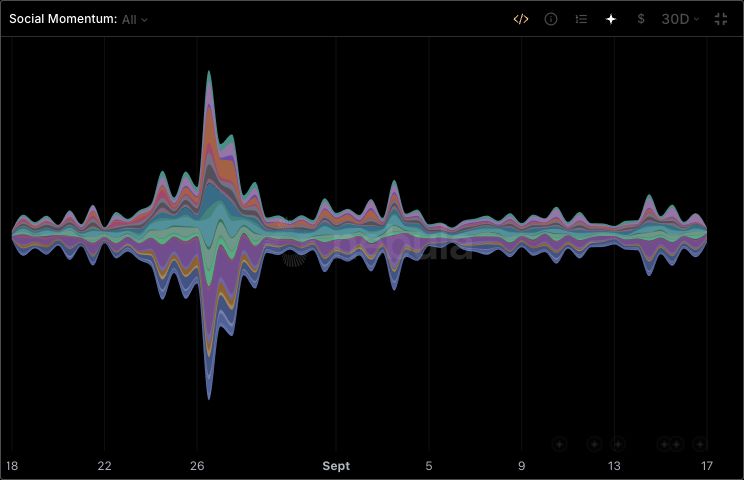
A view of which author clusters drive conversation over time. Each cluster reports posts, unique posters, bullish, bearish and neutral counts, and average post sentiment on the −100 to +100 scale. The chart’s bands show poster activity. The ranking view instead ranks the clusters by unique posters in each slice of the selected window and shows how many places each one moved over the period; a rank reflects order, not size, so a close second and a distant second look the same. Clusters overlap, so adding bands does not give a count of distinct people. For buckets spanning multiple hours, unique posters are summed from hourly distinct counts: the same author can count again in another hour. This measures participation, not price momentum.
NVIDIA’s Social Momentum chart. The bands show how cluster participation changes over time. Captured on 17 September 2026.
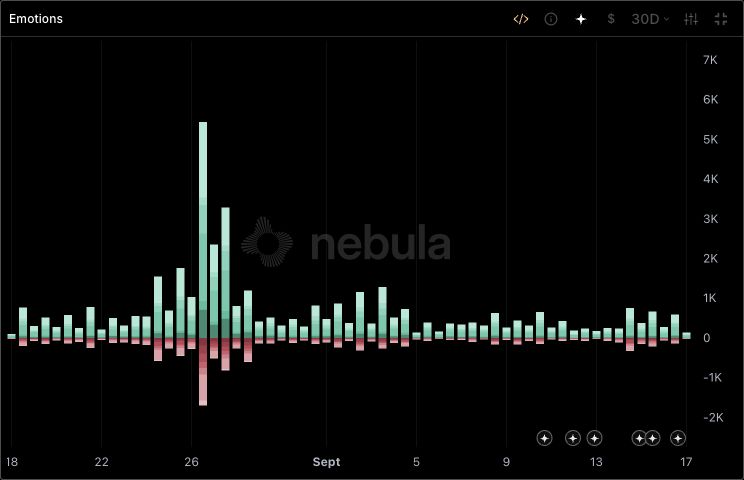
Nebula tags posts with anger, anticipation, boredom, confidence, disgust, distrust, fear, greed, joy, love, optimism, pessimism, sadness, surprise, and trust. A post can express several emotions. Each emotion’s proportion is its share of all emotion tags in the bucket, not the percentage of people feeling it. The proportions sum to one when tags exist; empty buckets report zero. Tags apply to the post, so a post mentioning several stocks contributes the same emotions to each. Bots are excluded. Emotion describes expression, while sentiment describes a directional stance.
The Emotions chart on NVIDIA’s profile, with the emotion selector in the header. Captured on 17 September 2026.
The time horizon expressed in a post’s market view: short term spans minutes to a week, medium term a few weeks to a few months, and long term three months or more. Each horizon uses the same rolling 24-hour, decay-weighted bullish-minus-bearish signal as Sentiment. These labels describe the author’s outlook, not the chart’s displayed date range. Posts without a stated horizon and bots are excluded. A crowd can be bearish in the short term and bullish over the long term.
Mindshare Change
The change in share of conversation between comparable periods. A move from 5% to 6% is +1 percentage point and +20% relative growth. These are different quantities; use the units shown by the view or field. Read the change with post volume because the market denominator can change even when the stock’s own activity is steady.
Narrative Rotation
The movement of attention between market themes, sectors, or stocks. For example, discussion may move from NVIDIA’s results to Amazon’s cloud outlook. Rotation describes a pattern in conversation, not proof that investment capital has moved. Check posts, participants, timing, and catalysts before drawing that conclusion.
Emotional Intensity
A general description of how strongly emotions appear in market discussion. It is not interchangeable with an emotion’s share of tags or with the Fear & Greed score. Use the specific metric and units shown in the response rather than assuming a separate universal intensity scale.
Emotion labels
These labels describe expression in tracked posts, not a diagnosis of the author or a model-certainty score. A post can carry several labels or none. Each API proportion uses all emotion tags in its bucket as the denominator; chart selectors may show a subset.
Anger (emotion)
Frustration, resentment, or hostility expressed in a post, for example anger at an earnings surprise or management decision. Anger can accompany several directional views; it is not itself a short call or proof of wrongdoing.
Anticipation (emotion)
Expectancy or eagerness about something that may happen, such as an upcoming NVIDIA earnings release. It describes waiting for a development, not confirmation that the event occurred or a forecast of its result.
Boredom (emotion)
Disinterest, impatience, or a sense that little is happening. It can appear during quiet trading or repetitive discussion, but a boredom tag is not proof of low exchange volume or absent investor interest.
Confidence (emotion)
Expressed assurance or certainty about a view, decision, or situation. This is the tone of the post, not the classifier’s confidence score, a calibrated forecast probability, or Nebula’s separate Conviction Index.
Disgust (emotion)
Strong aversion or repulsion expressed toward a situation, behaviour, or subject. It describes the post’s emotional content rather than establishing a factual or ethical conclusion about the target.
Distrust (emotion)
Suspicion or lack of faith in a source, person, institution, or claim. Distrust is an expressed reaction, not verification that the source is dishonest or the claim is false. Inspect the evidence behind the concern.
Fear (emotion)
Apprehension or anxiety about possible adverse outcomes. The fear emotion tag describes expression in posts; it is distinct from Nebula’s composite Fear & Greed score, which also incorporates market and social measurements.
Greed (emotion)
A strong appetite for gains or accumulating more, as expressed in discussion. Greed tags are not measured buying, verified position sizes, or the complete Fear & Greed index. They can contribute to broader metrics while retaining their own meaning.
Joy (emotion)
Happiness, delight, or celebration expressed in a post, such as a positive reaction to a result. Celebration can concern a past event or a personal experience; it does not by itself predict the next price move.
Love (emotion)
Affection, attachment, or enthusiasm for a subject, product, or community. It differs from a verified holding or a permanent commitment. Strong attachment can coexist with other emotions or a cautious market view.
Optimism (emotion)
A hopeful or positive expectation about future developments. It expresses outlook rather than proof of a favourable outcome, and it need not be a qualifying directional call about a particular stock.
Pessimism (emotion)
A negative expectation about future developments. It is distinct from an already realised loss, a verified adverse event, or the Doomers author cluster, which describes a recurring account-level pattern.
Sadness (emotion)
Sorrow, disappointment, or a sense of loss expressed in discussion. It may concern market outcomes or another subject in the same post. The label does not establish the author’s actual financial loss or mental-health status.
Surprise (emotion)
An unexpected reaction to an event or observation, which can be favourable or unfavourable. The API can return this label, while the current paired emotion chart displays the other fourteen labels and leaves Surprise unpaired. Its absence from that chart is therefore not proof that no surprise was detected.
Trust (emotion)
Expressed belief in the reliability or integrity of a source, organisation, person, or process. It is an emotional signal in the post, not Nebula’s verification of the source or a security assessment. Trust in a source and confidence in a prediction are different ideas.
Charts and additional metrics
Product-specific meanings for price context, conviction, and chart controls.
Conviction Index / Cultiness
Conviction Index measures how strongly positive community expression persists, including when price or the broader market’s sentiment does not support it. The chart uses a 0–100 score and is also identified as cultiness in some technical interfaces. Its current calculation blends four equally weighted components: sentiment relative to the wider market, sentiment’s behaviour during price moves, the latest positive sentiment ratio, and greed expression. It then rescales and bounds the result. Several comparisons use seven-day windows. A high reading describes expressed conviction, not verified holdings, fundamental value, loyalty of every investor, or a guaranteed future return. Missing inputs can receive neutral component defaults.
Social Volume Profile
Social Volume Profile regroups tracked posts into price bands based on where the asset traded when the posts appeared. Bar width is relative to the busiest band, and the sentiment split shows bullish versus bearish discussion at those levels. It is social activity at traded prices, not exchange trading volume, an order book, or price targets stated in posts. The interactive chart can recalculate over the visible range, so panning and zooming may change the profile. Buckets without a sufficiently recent price are excluded; coverage and observation cadence can make the chart differ from a separately sampled API profile.
Point of Control / POC
In Nebula’s Social Volume Profile, the point of control is the price band with the most allocated social posts in the selected range. It identifies the busiest level of discussion, not the price with the greatest executed trading volume or a guaranteed support/resistance level. Changing the visible date range or price bins can change the POC. Use it with the price path, the band’s sentiment balance, and the actual posts; do not interpret it as a pending limit order or an investor’s entry price.
Profile Delta and Significance
For a Social Volume Profile band, delta is (bullish posts minus bearish posts) divided by directional posts, ranging from −1 to +1 when direction exists. Balance reflects how contested the band is: it is highest near an even bullish/bearish split. Significance is a relative emphasis measure combining activity, balance, repeat price visits, and compression; the strongest band is normalised to one. These are properties of the selected profile, not probabilities of future price reactions. Thin or unpriced data limits their interpretation.
Price Interest / Price Levels
Price Interest maps explicit price levels mentioned in posts into a heatmap alongside the instrument’s price history. One post can mention more than one level, so level counts are not unique authors or posts. The view asks which prices the crowd discusses, whereas Social Volume Profile asks where price was when discussion occurred. A mentioned level may be a target, scenario, or reference point; it is not automatically support, resistance, fair value, or an executable order. Time and price bucketing, plausibility filtering, and the displayed price path affect the heatmap.
Price History and Candles
Price history provides market context alongside social signals where a compatible instrument and quote history are available. A candle summarises open, high, low, and close within its interval; it is not a sequence of every trade. Compare the price instrument, quote timestamp, interval, and any proxy identity before attributing a move to discussion. Market hours, delayed observations, and missing history can produce gaps. A private stock or non-asset topic need not have price data, and Nebula’s social coverage does not imply exchange-grade execution data.
Price Momentum
Price momentum describes the direction and size of price movement over a specified window. It is distinct from Social Momentum, which measures participation in discussion, and from Mindshare change, which measures a share of attention. Fear & Greed uses a particular price-momentum component within its composite calculation; a different price-change column can use another horizon. A rising price can coincide with falling attention or bearish commentary. State the period and instrument rather than using momentum as a universal, unitless label.
Volatility
Volatility describes how much prices fluctuate over a measurement window. Higher volatility means larger variability, not necessarily a rising or falling trend. Nebula’s available volatility measures use historical price observations; an instrument’s displayed volatility series and Fear & Greed’s transformed volatility component are different quantities. Check the units and horizon returned by the relevant view before comparing them. Sparse or irregular prices affect interpretation, and realised historical volatility does not establish the probability or size of a future move.
Trading Volume
Trading volume measures market trading activity, often expressed in USD where the data source provides that measure. It differs from Social Volume, which counts posts, and from Social Volume Profile, which distributes posts across price bands. Check the instrument, currency, interval, and source before comparing values. Volume may be unavailable for some stocks, proxies, private stocks, or topics. A rise in traded value does not by itself reveal net buying, the identities of traders, or whether the next price move will be up.
Chart Timeframes and Buckets
The timeframe control chooses how much history a chart displays. Buckets group observations into intervals, so a longer range can use coarser points. This is separate from the calculation window behind a point: sentiment and Mindshare use rolling 24-hour readings, while other metrics have their own horizons. It is also separate from a post’s short-, medium-, or long-term outlook. When comparing charts, align these choices and the selected identity; a difference caused by aggregation is not necessarily a disagreement in the underlying data.
Chart Overlays
Price, intelligence, and post-volume overlays add context to supported charts. Their axes and units may differ from the main metric, so a line crossing another line has no meaning unless both use a comparable scale. An intelligence marker provides event context; it does not prove the event caused the price or sentiment move. Page or dashboard controls can coordinate overlays, while a tile may retain a local override. The Mindshare chart’s forecast toggle draws a Mindshare Forecast forward of the line. Toggling an overlay changes the presentation, not the definition of the underlying signal.
Top Trending
Top Trending ranks tracked assets or subjects by share of conversation within the selected universe. It identifies where attention is concentrated, rather than which stocks rose most or which are most bullish. Check whether the view is ordered by current Mindshare, percentage-point change, or relative growth; those sorts answer different questions. A familiar stock can lead by absolute share while a small subject leads by relative growth. Read the post counts alongside the ranking to understand the scale of activity.
Heatmaps and Treemaps
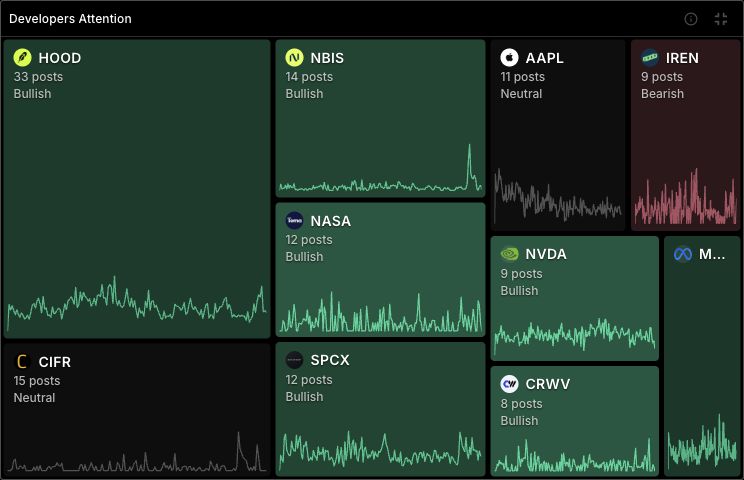
These views use area, colour, or intensity to summarise many assets, or many pairs of clusters, at once. The encoding is specific to the view: size may represent post volume or attention share, while colour may represent sentiment, change, or how often two clusters agree. A large cell is not automatically a large market capitalisation or a bullish recommendation. Read the view’s labels and selected filters, then open the underlying profile for detail. Clusters can overlap in membership, so a view that sums them is not a partition of unique people.
The Developers cluster’s attention treemap, showing the stocks it discusses. Captured on 17 September 2026.
The Cluster Quadrant, which plotted each cluster’s change in Mindshare against its net sentiment on the clusters page, is no longer available. To compare how bullish clusters are, use Stance vs Market in the clusters page’s table, which sets each group’s bullish share against the market’s; to see which groups lean together, use Cluster Agreement.
Cluster Profile
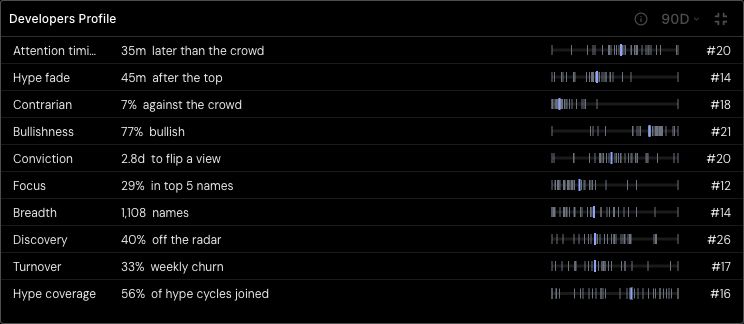
A cluster’s profile ranks it against every other cluster on ten behavioural traits over a 30- or 90-day window: attention timing; hype fade (whether its bullishness peaks before or after its own attention on a hype cycle); contrarian share (names where it and the market lean clearly opposite ways); bullishness; conviction (how many active days it holds one stance on a name); focus (share of its posts on its top five names); breadth (names it discussed at least three times); discovery (share of its posts outside the market’s 100 most-discussed names); turnover (weekly churn in its top ten names); and hype coverage (share of the market’s hype cycles it joined). On the clusters page, Profile Extremes shows each trait across every cluster, with the lowest and highest named. Traits need enough data, so a small cluster may have no reading. They describe posting behaviour, not skill or returns.
The Developers cluster’s 90D profile, including its attention timing relative to the crowd. Captured on 17 September 2026.
Attention timing measures how much earlier or later a cluster’s posts arrive than everyone else’s on names whose attention spiked. For each hype cycle, it reads the day either side of the crowd’s busiest hour, hour by hour, and compares the cluster’s posts with the average hour of everyone else’s; every post of every cycle is pooled. A cluster needs at least 20 cycles for a reading, and its likely range is the middle 80% of bootstrap resamples. Leads are usually minutes to a couple of hours, and ranks change between windows. Being early describes when a group talks, not whether it is right.
Hype Cycles
A hype cycle is a name whose market discussion peaked inside the window at least three times its median day and on at least 50 posts. The clusters page lists the window’s biggest recent cycles: the crowd’s posts hour by hour in the day either side of its busiest hour, and each cluster’s arrival as the average hour of its posts against that peak, with the first three named. A cluster needs at least three posts in the cycle for an arrival. Arrival order in one cycle is noisy; Attention Timing pools many cycles for a steadier reading.
Stance vs Market
Stance vs Market is a cluster’s bullish share (bullish posts as a share of bullish plus bearish posts) minus the market’s over the same window and markets, in percentage points. Almost every group and the market lean bullish, so the gap, not the raw share, shows who is more or less optimistic than the crowd; for example, +8 pts means the cluster’s directional posts were 8 points more bullish than the market’s. The clusters page table’s daily attention bars use the same comparison: green on days the cluster leaned more bullish than the market’s window average, red when it leaned less. Posting communities are compared with the equity market they discuss.
Most Divisive Assets
Most Divisive Assets lists the widely discussed names on which clusters disagree most. Among the market’s 200 most-discussed names in the window, it keeps those on which at least 20 clusters have eight or more directional posts, then ranks them by how evenly the clusters divide: the smaller side’s share of the clusters leaning clearly bullish or bearish (at least 0.1 either way), with the spread of the middle half of clusters breaking ties. A few outlying clusters therefore cannot make a name divisive when nearly every other group agrees. Each cluster appears as a line from bearish to bullish, with the most bearish and most bullish highlighted, beside a count of clusters leaning each way. A divisive name has divided conversation, not necessarily a divided market or a coming move.
Calls and performance
How directional statements become research observations and historical outcomes.
Calls / Long and Short Calls
A call is a directional market statement extracted from a public post and associated with an instrument, author, and time. Long calls express a bullish view and short calls a bearish view. The Calls view counts extracted calls; it does not count executed orders, open leveraged positions, or all bullish and bearish posts. A post can express sentiment without making a qualifying call. Inspect the source and extracted context before relying on the classification, and use the stated outcome horizon when evaluating performance.
Social vs Trading Volume
The Social vs Trading Volume index compares an instrument’s social attention with its actual trading activity, each measured over the trailing week against its own 90-day normal, on a 0–100 scale. 50 means the two are in step; above 50 trading is running ahead of the conversation, below 50 the conversation is running ahead of trading. It compares two volumes rather than forecasting price, and a move can reflect growing coverage as well as real interest, so read it beside price and volume.
Call Entry Price
A call’s entry price is the price reference used to evaluate the statement from around its recorded time. It is a research mark, not evidence that the author or a user traded at that price. Extraction timing, price availability, and the selected instrument affect the reference. The last price is a later market observation and should not be confused with a resolved horizon’s exit mark. Inspect the original post, entry timestamp, and return horizon before comparing calls.
Call Returns
Call returns measure price movement relative to the recorded entry and are signed for the direction of the call: a favourable move for a short call is a price fall. Nebula reports outcomes at fixed horizons such as 24 hours, seven days, and 30 days where sufficient price history exists. These are historical research marks, not brokerage statements. A positive marked return does not demonstrate that the author executed the trade, used the assumed size, paid no fees, or could obtain that exit price. Always compare like-for-like horizons.
Resolved and Unresolved Calls
A resolved call has an outcome mark available for the horizon being measured. A recent call may have a 24-hour result but no seven-day or 30-day result yet; missing price coverage can also prevent an outcome. Unresolved does not mean incorrect, and an absent return is not zero. A call’s long-term outcome can differ from its early outcome. When reviewing win rates or distributions, distinguish the eligible calls with measured outcomes from all calls published in the period.
Win Rate
Win rate is the share of evaluated outcomes counted as wins under the relevant view’s rules. Its denominator depends on horizon, eligibility, and available outcome marks; it should not be read as the chance that the author’s next call will succeed. A high win rate can coexist with poor average returns if losses are larger than wins. Check sample size, unresolved calls, and market mix. Caller-ranking statistics can use several resolved horizon observations from the same call, so they are not automatically a count of independent trades.
Average Return
Average return summarises the marked percentage returns of the eligible observations in a selected view. It differs from win rate, cumulative P&L, and a portfolio’s compounded return. A few extreme outcomes can move an average substantially, so also inspect the return distribution, sample size, time horizons, and eligibility rules. Ranking calculations may cap outlier returns or apply statistical adjustments, which means a ranking score should not be reconstructed from a displayed average alone. Historical averages are descriptive, not forward-looking guarantees.
Return Distribution
The return distribution groups resolved calls by the size of their outcome. Negative outcomes appear to the loss side and positive outcomes to the gain side, allowing you to see whether performance is concentrated near zero or driven by a small tail of large wins or losses. It describes the included calls and horizon, not every trade made by the author. Missing outcomes and filters change the sample. Read it alongside win rate and average return rather than reducing performance to one number.
Hypothetical P&L
The Calls performance view can display cumulative P&L using an illustrative $100 allocation per call. This standardises observations for comparison; it is not the author’s actual account balance, an executable backtest, or your portfolio’s return. Overlapping calls, real position sizing, fees, slippage, borrow costs, and execution constraints are not established by the display. A $100-per-call curve is also different from compounding an account. Treat it as a visual summary of the marked sample and inspect the underlying outcomes before drawing conclusions.
Caller Rankings and Eligibility
Caller lists are dated selections based on recorded directional calls and resolved outcomes. The current eligibility logic looks back up to 90 days, requiring five distinct calls across three assets with a full history; partial-history periods scale the gate down with floors of two calls and two assets. Eligibility alone does not guarantee selection. Nebula supports a model-ranked caller path targeting 250 entries and a formula-based path with separate market-universe caps; thin history can trigger fallback. Consequently, there is no universal win-rate cutoff or guaranteed fixed live membership count. Read the current list and effective date rather than assuming that a code limit equals today’s population.
Intelligence and research workflows
How to move from an aggregate signal to its supporting evidence.
Intelligence / Insights
Intelligence contains generated and curated summaries of events, themes, and narratives drawn from tracked material. It helps explain what happened, why people are discussing it, and which subjects are involved. Filter by relevant scope, tag, sentiment, or date, then inspect the source evidence. A summary is an interpretation of available material, not proof that every reported claim is true. A rumour, proposed action, and completed event have different statuses even when they concern the same stock.
AI Overview
The AI Overview is a concise account of what is happening around a subject and why, assembled from recent posts, intelligence, sentiment, and available price context. It is refreshed as it ages or material context changes, so it is not a fresh model run for every visitor or a guarantee of instantaneous news coverage. Use it to orient yourself before opening the detailed charts and sources. Missing inputs, source uncertainty, and the distinction between reported facts and interpretation still apply.
Market Digest
A market digest groups recent intelligence into an editorial overview of the market’s main developments. It is useful for orientation across stocks and themes before narrowing to an instrument. A digest is selective: omission does not mean that nothing happened, and a headline’s prominence is not a numerical forecast of returns. Follow the underlying story or subject profile to inspect timing, evidence, and related signals. Digest content can differ from an individual stock’s AI Overview because the scope is broader.
Catalyst Calendar
The calendar groups scheduled and past catalysts by day. Greater visual emphasis reflects more events or greater event significance, not the probability that prices will rise. Selecting a day filters the Intelligence table; selecting another day can define a range, and selecting the same day again clears it. Scheduled dates and event details can change. Read the event’s status, timestamp, and supporting sources to distinguish an expected release from a confirmed outcome, and verify the relevant timezone when timing matters.
Intelligence Tags
Tags classify the subject of an intelligence item: for example earnings, guidance, an SEC filing, a product launch, or a central-bank decision. Several tags may describe the same development. They help filter and group stories; they are not separate independent pieces of evidence, confidence scores, or trading recommendations. The event-type definitions in this reference explain the vocabulary. Always distinguish the kind of event from its status: an acquisition rumour and a completed acquisition can share a topic but have very different implications.
Sources and Evidence
A source link identifies the material behind a post, insight, or agent claim. Open it to check the wording, author, publication time, and whether the material reports a fact, opinion, allegation, or forecast. Multiple reposts or overlapping clusters can repeat the same original claim, so mention count is not independent confirmation. A glossary link supports a product definition; it does not support a current price or live ranking. For current analysis, prefer the returned observation and timestamp alongside the original source evidence. 4chan source posts use board and post identity, link to their original thread, and display Anonymous without an author profile. Stored text can remain available after the original thread disappears; anonymity does not establish independent authors or reliable attribution.
Conflicting Signals
Nebula signals answer different questions and need not move together. Mindshare can rise while sentiment falls when negative news attracts attention; bullish sentiment can persist while price drops; clusters can disagree because they have different horizons and incentives. First align the instrument, window, market, and filters, then examine the posts and catalysts behind the divergence. Do not average incompatible scales such as sentiment’s unbounded signal and Fear & Greed’s 0–100 score. Divergence is a research question, not an automatic reversal signal.
Related topics and the Nebuliser
Relationships inferred from discussion, rather than ownership or causality.
Related Topics
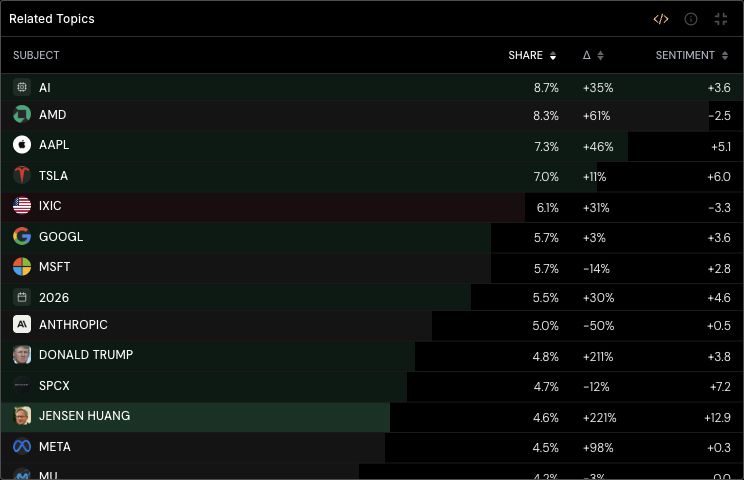
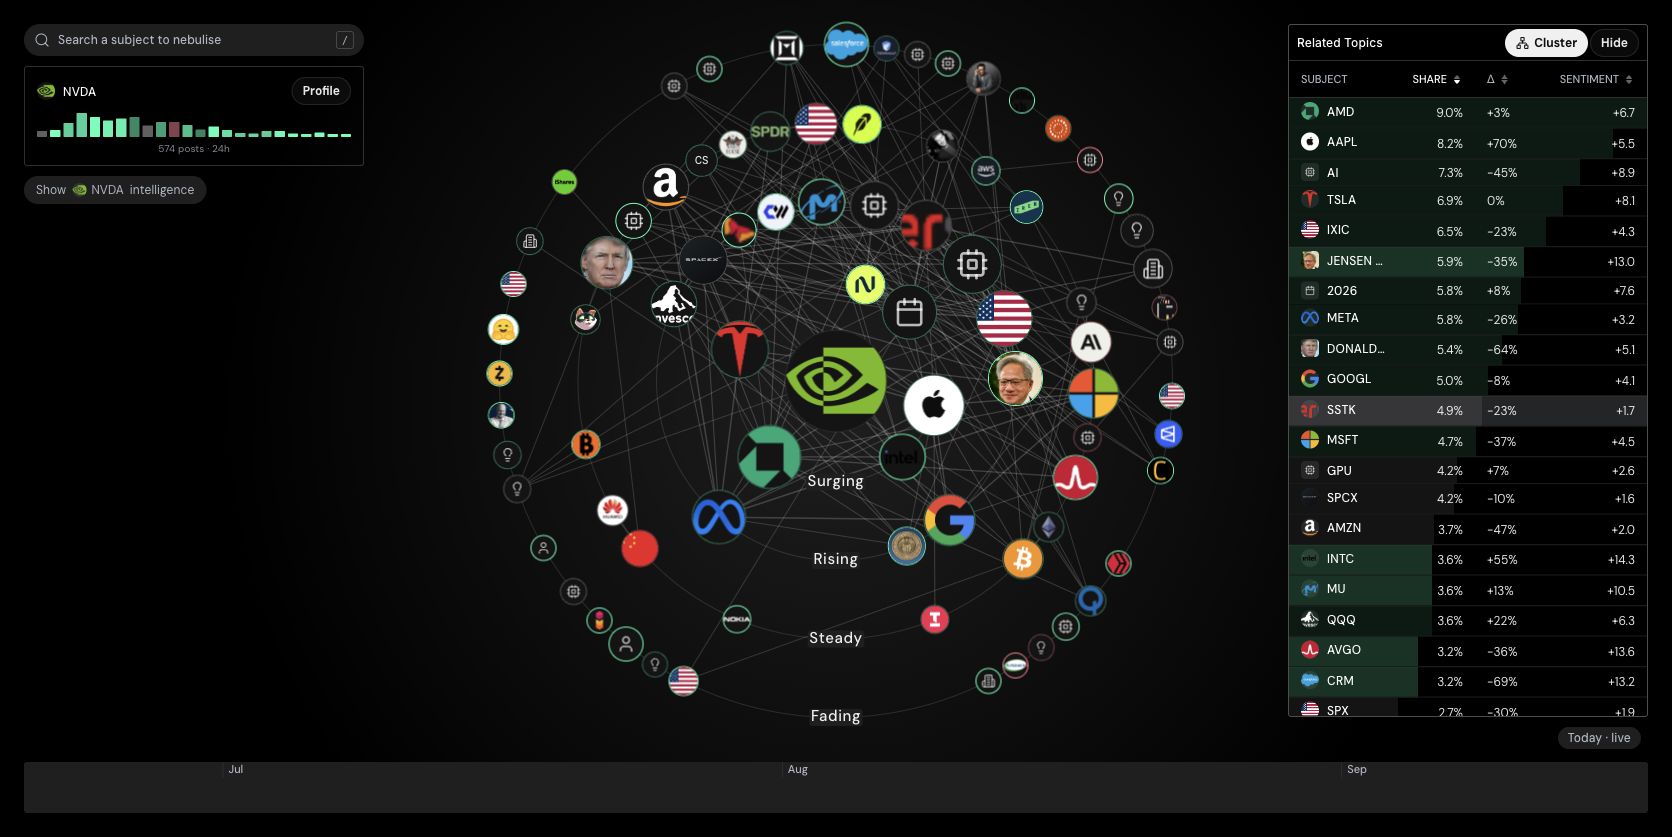
Related Topics identifies subjects discussed alongside the current stock or topic. The table compares shared activity, conversation share, changes in activity, and the anchor’s sentiment when the related subject appears. This conditional conversation share is different from an asset’s market-wide Mindshare. A relationship means co-occurrence in tracked discussion; it does not establish ownership, a commercial contract, causality, or price correlation. Open a related subject or its shared intelligence to investigate why the connection appears.
Related Topics on NVIDIA’s profile. These shares describe its conversation neighbourhood. Captured on 17 September 2026.
The Nebuliser is Nebula’s interactive map of a stock or subject’s conversation neighbourhood. Search for an anchor, examine the surrounding subjects, select a node to inspect its profile or shared intelligence, and make it the new centre to explore further. The related table and graph draw on the same underlying relationships, with the graph displaying as many nodes as fit legibly. Use the timeline for historical context and Back to live to return to the current view. The map represents discussion relationships, not a supply-chain database or a causal model.
Nebuliser Nodes and Rings
Node size reflects how much of the anchor’s conversation a related subject holds. Ring position combines activity with its change: the named tiers run from Surging and Rising toward Steady and Fading. A large subject can be fading while a smaller subject is gaining momentum, so size and distance answer different questions. Colour reflects the anchor’s sentiment in discussion containing that neighbour. These are relative visual encodings for the selected neighbourhood and period, not price forecasts or fixed numerical thresholds applicable across every graph.
Co-mentions and Graph Links
A co-mention occurs when subjects appear together in tracked discussion. Graph links connect related subjects that turn up together, with the displayed network filtered for legibility and relative relationship strength. A missing line can reflect display filtering rather than proof of no relationship. A strong link can arise from repeated coverage of one story, not several independent sources. Use the shared posts and intelligence to interpret the connection; never treat co-mention frequency as proof of causation, ownership, or an actual business partnership.
NVIDIA in the Nebuliser. Links connect subjects discussed together. Captured on 17 September 2026.
Grouping in the Nebuliser organises related subjects by the structure of their discussion links. These graph groups are distinct from author clusters such as Developers or Smart Money: one groups subjects in a neighbourhood, while the other groups the people speaking. A group’s membership depends on the current graph, anchor, period, and available relationships. It is not an official industry taxonomy or a permanent classification. Ungrouping changes the presentation so you can inspect individual subjects and links again.
Nebuliser Timeline
The timeline changes the day or historical context used to inspect a subject’s neighbourhood. It helps compare which relationships and narratives were prominent at different times. Back to live returns to the current view. A historical graph reflects the coverage and processed data available for that period; it is not proof of what every investor knew at that moment. Keep the anchor and other filters consistent when comparing days, and distinguish newly visible relationships from changes caused by data availability or graph display limits.
Dashboards and Ask Nebula
Personal research organisation and the agent’s capabilities.
Custom Dashboards
A custom dashboard is a saved arrangement of charts, intelligence, and notes. Use Add Dashboard Unit, choose a supported unit and subject, then move or resize units to organise a research workflow. Dashboard-wide timeframe and overlay controls coordinate units, while saved tile-local overrides take precedence. You can rename, duplicate, and manage a board’s visibility. Dashboards are research layouts, not brokerage portfolios, automatic trading systems, or a guarantee that every selected instrument has all metrics.
Dashboard Units / Tiles
A unit is an individual dashboard view, such as Mindshare, Sentiment, Calls, Price Interest, intelligence, or a note. Each unit can carry its own subject, filters, timeframe, and compatible overlays. Units without a local override follow the dashboard’s shared settings. If two units disagree, compare their saved configuration before assuming a data error. Removing a unit changes the saved layout; it does not delete the underlying stock, post, or market history. The current dashboard configuration supports up to 30 units.
Public and Private Dashboards
Visibility controls whether a saved dashboard can be viewed publicly or remains private to its owner. Use the dashboard actions and Copy link to share a board after checking its visibility. Public viewers do not become owners and cannot edit the original simply by having the link. Sharing exposes the board’s visible configuration and note content, so include only material intended for that audience. Public visibility does not necessarily bypass sign-in, plan, or data-access requirements of every embedded feature.
Notes
A note unit holds user-authored text, including supported Markdown such as headings and lists. It is useful for a research thesis, questions, or a record of assumptions alongside live charts. Notes are saved content, not Nebula-verified intelligence, and can become outdated as events change. A public dashboard can expose its notes to viewers. Distinguish what you wrote from retrieved evidence and generated analysis, particularly when asking the agent to reason about the board.
Ask Nebula / Agent
Ask Nebula answers questions about the platform and supported market intelligence. It uses this product reference for definitions and workflows, and its available Nebula tools for current observations. Open it from the app or use the full Agent page; relevant page or dashboard context can accompany your question. Specify the stock, window, and comparison when asking for analysis. It is not a brokerage agent and should not claim to have changed a dashboard, billing setting, or account unless an available action actually completed.
Agent Context
Context tells Ask Nebula what you are viewing, such as a selected stock, subject, or dashboard and its configured units. It helps resolve phrases like “this chart” or “compare these signals”. Context is not a complete screen recording and does not imply access to every tab, private account field, or external document. If the intended subject or timeframe is missing or ambiguous, name it explicitly. The agent still needs supported data tools for current observations and must distinguish context supplied by the interface from independently retrieved evidence.
Auto and Deep Think
The agent’s speed control selects a faster Auto mode or Deep Think for more involved reasoning. Deep Think can take longer and use more model computation, but it does not grant additional datasets, change your plan, or make missing information available. Both modes should use the same metric definitions and identify relevant limitations. More reasoning is not a guarantee of correctness. For a simple product definition, a short answer with the relevant glossary link is normally sufficient.
Agent Conversation History
Recent chats let you return to prior questions and start a new conversation when the research context changes. A previous answer is tied to the data and time available when it was produced; reopening it does not make its numbers current. Ask for a fresh reading when needed. Deleting a conversation is different from deleting your account or cancelling billing. Saved context can help a follow-up question, but the agent should still resolve ambiguous identities and avoid carrying an old timeframe into a new request.
Agent Capabilities and Limits
Ask Nebula can explain documented platform behaviour and query the data exposed by its current tool catalog. It must not invent undocumented formulas, current prices, account balances, plan entitlements, holdings, source evidence, or successful actions. Some product views have no corresponding agent tool; documentation explains those views without creating access to them. A definition needs no live data lookup, but a current reading does. For an unsupported account task, the useful answer is a clear explanation and the relevant settings or support destination.
Account, access, and credits
How access and usage work, with account-specific state kept separate from definitions.
Sign-in and Account
Signing in identifies your Nebula account so features such as saved dashboards, conversation history, credits, and developer credentials can be associated with you. Account settings let you review profile and sign-in details. A public market page can have different access rules from an authenticated saved workspace. If access appears inconsistent, check the account currently signed in and the relevant feature’s plan requirements. The glossary cannot establish your current subscription or confirm that an authentication change has succeeded.
Account Settings
Settings is the destination for profile and sign-in details, notification preferences, rewards access, and billing links. Use the controls shown for your account to change supported details, and follow the password-reset workflow if you cannot sign in. The support area provides help for tasks that are not self-service, including account-deletion requests. Updating your display name, deleting a chat, cancelling a plan, and deleting an account are distinct operations. Ask Nebula can explain where to go but should not claim to perform these actions without a supported tool.
Notification Preferences
Notification preferences control supported Nebula email categories, such as product and marketing updates. They are not a custom market-alert rule builder and do not make Ask Nebula continuously monitor a stock after a conversation ends. Review the toggles in Settings for your account. If you need an automated alert, first verify that the relevant product or developer workflow actually supports the trigger and delivery channel; a saved dashboard or a request in chat alone does not establish an active monitor.
Plans and Entitlements
A plan determines allowances such as included credits, request throughput, and accessible history. An entitlement is the access rule that the service actually enforces for an account and feature. Buying usage credits is different from upgrading those limits. Use the current Pricing and Subscription pages for available plans, amounts, and terms, and your account’s returned status for what applies to you. Static documentation must not infer a paid plan, remaining balance, or renewal date from the fact that a user can open the app.
Shared Credits
Nebula’s agent and Developer API draw on the account’s shared credit system. Included plan credits and eligible purchased credits contribute to available usage. A credit is a billing unit, not one post, one answer, one token, or one API request: different operations can cost different amounts. A few Developer API operations also price by the request or the answer: a mindshare forecast costs more when re-run on the latest data and nothing when the asset cannot be forecast, though an account that keeps asking for forecasts of such assets is paused on that operation for up to an hour. A Developer API request that ends in an error is refunded. The agent’s charge depends on measured model usage with a minimum run charge. Check the account usage view for actual consumption and cycle dates. A glossary-only answer still uses the model and can consume agent credits even though it makes no market-data call.
Agent Credit Cost
The current agent billing calculation rounds estimated model cost in USD multiplied by 1,000 up to a whole number of credits, with a minimum of 10 credits per run. At least the minimum balance is required to start a run. More involved analysis or Deep Think can consume more computation; the exact charge depends on recorded usage rather than message length alone. This is an explanation of the versioned calculation, not a quote for a future answer. The account’s recorded usage and current billing rules determine the actual charge.
Included and Purchased Credits
Included credits belong to the plan’s current usage cycle; purchased credits are prepaid grants with their own remaining balance and expiry. The shared system consumes available plan allowance before eligible purchased credits. Purchased credits do not themselves upgrade your history window or request-per-minute limit. Nebula’s credit checkout currently describes purchased credits as valid for 12 months, but check the displayed expiry and terms for the specific purchase. Your current balance, next expiry, and cycle dates require the account usage page, not a static glossary.
Automatic Credit Top-up
Auto top-up can purchase more prepaid credits when the balance reaches a configured threshold. It uses the saved payment method, threshold, and purchase amount configured in the billing workflow. A successful initial purchase and usable payment method are required before enabling it. A failed payment can leave the balance exhausted; enabling the option is not proof that a purchase completed. Review the account’s settings, failure status, and purchase history. Auto top-up replenishes credits, not subscription entitlements or the request-rate ceiling.
Credit Exhaustion
Credit exhaustion means the account lacks sufficient eligible credits for the requested operation or minimum agent run. It differs from a rate-limit error, which concerns requests over time, and from a missing-data response, which concerns coverage. Check included allowance, cycle dates, purchased balance, expiry, and any auto-top-up failure in the usage and billing pages. If necessary, buy credits or wait for the applicable reset. The agent cannot establish your live balance from a general product question or from the glossary alone.
Billing and Cancellation
Billing and Subscription pages show the relevant product subscription, payment-management controls, and available invoice or renewal details. Follow the current account workflow to change or cancel a plan; verify the returned subscription status and effective date afterwards. Cancelling a subscription, disabling auto top-up, deleting an API key, and deleting your account are different actions. The glossary cannot establish a refund entitlement, invoice amount, or individual renewal date. Those depend on the account record and the applicable published terms.
Referrals and Rewards
Rewards provides a referral link and tracks referral status, pending rewards, eligible amounts, and payouts where available. A referral generally must qualify under the current programme before a reward becomes withdrawable; sharing a link or creating an account is not proof of qualification or payment. Availability and withdrawal controls can depend on account state and the payout setup. Check the Rewards page for the current rules and status. Product access incentives, API-related incentives, and cash payouts should not be treated as interchangeable.
Support and Feedback
Use the support destination shown in Nebula or contact support@hiddensystems.ai for account-specific issues and questions that the available workflows cannot resolve. A useful report includes the affected page, stock or subject, timeframe, filters, timestamp, and the difference between expected and observed behaviour. Do not include passwords or full API keys. Ask Nebula can help explain a metric or narrow down a scope mismatch, but it should not claim to have filed a support request, issued a refund, or changed private account state unless a supported action confirms it.
Developer API, MCP, and CLI
Programmatic access to global markets intelligence across equities, commodities, indices, crypto, and AI.
Developer API
The Developer API exposes Nebula’s supported global markets intelligence capabilities over HTTP, covering equities, commodities, indices, crypto, and AI-related subjects. It provides a programmatic interface to defined resources and analytics, not automatic access to every chart or internal data store in the web app. Use the published endpoint documentation for selectors, fields, units, history, authentication, and credit cost. The typed public contract and generated OpenAPI describe supported behaviour. Start in the API portal and developer documentation rather than copying an internal browser request.
API Keys
An API key is a credential used to authenticate supported developer requests to your Nebula account. The Keys page manages named keys, status, and available creation, replacement, and revocation controls. A revoked key stops authenticating requests, while the account and subscription remain separate. Key names or visible prefixes identify credentials but are not substitutes for the complete secret. Store secrets in an appropriate server-side environment and use the current documentation’s authentication format. Never paste a full key into a public dashboard, URL, repository, or support report.
API Usage
The Usage page reports requests and credit consumption across API keys and endpoints over the relevant billing period. Requests and credits are different measures: one request can consume more than one credit, and agent usage has its own usage-based charge within the shared balance. Filters and hourly or daily aggregation affect the view. Compare the selected interval with the plan cycle before interpreting totals. The glossary describes the accounting concepts; your actual usage requires authenticated account data.
Rate Limits
A rate limit constrains how quickly an account or credential can make requests, commonly expressed as requests per minute. It is distinct from the number of available credits and the history window. A request-rate error does not necessarily mean you need to buy credits; reduce or space requests and follow the response’s retry guidance. Limits can vary by plan or endpoint. Read the current account and endpoint documentation rather than assuming the same limit applies to every product operation.
History Access
History access controls how far back an account can request data for an eligible operation. It does not guarantee that an asset or source has observations throughout that period. A plan may permit a long window while a newly tracked stock has only a short history. Endpoint limits, aggregation, and metric lookback requirements can further affect the returned series. Buying prepaid credits increases available usage but does not automatically grant deeper history. Use the plan and endpoint documentation together with actual response timestamps.
Model Context Protocol / MCP
MCP lets a compatible AI client discover and call Nebula’s supported tools through a standard interface. Nebula’s MCP tool definitions are generated from its public API contract so that supported selectors and validation stay aligned. Connecting a client does not provide unlimited data, remove authentication, or bypass credits and plan limits. The client decides when to call tools and how to explain their results. Use the developer setup instructions for the supported connection method; the glossary supplies product meanings, not a separate list of invented MCP capabilities.
Command-line Interface / CLI
Nebula’s CLI makes supported public API operations available from a terminal for repeatable research and integration workflows. Commands are generated from the same contract as the API, rather than being an independent product catalog. Authentication, selectors, limits, and credit consumption still apply. Use the installed version’s help and developer documentation for exact command syntax. A CLI response containing sentiment or Mindshare has the same metric semantics as the corresponding public endpoint; it does not become a trading instruction merely because it is scriptable.
OpenAPI and Public Contract
OpenAPI is the machine-readable description of supported public operations, parameters, response fields, and errors. It supports documentation and the generated MCP and CLI interfaces. Use it to determine whether an operation supports whole-market scope, which selectors are required, and how values are expressed. A glossary entry explains a product concept but does not create an endpoint for it. Public selectors and fields can differ from older internal names, so use the current contract rather than guessing a route from a chart title.
Agent API and Streaming
Nebula exposes a documented agent interface for supported developer integrations, including an OpenAI-compatible workflow and streaming where specified by the public contract. Streaming delivers answer content progressively instead of waiting for the complete answer; it does not make intermediate reasoning or partial text a verified final result. The agent still uses the account’s authentication, allowances, and supported data tools. Read the current endpoint schema for request and event formats. A completion does not imply that every requested external action or unsupported data fetch was performed.
Connected-client Consent / OAuth
The consent screen authorises a connected client to access the permissions shown for your Nebula account. It is distinct from the API key management workflow and should be read in the context of the requesting client. A connection does not remove the platform’s data, rate, or credit limits. Review the named client and requested access before continuing, and use the available account or client controls to manage that connection later. Ask Nebula should explain the workflow without inventing a permission grant or claiming that consent has already been given.
API Errors and Empty Results
An error response and an empty successful result mean different things. Invalid selectors concern the request; authentication or entitlement errors concern access; rate-limit responses concern throughput; server errors concern processing. A successful response with no observations can reflect the chosen window, filters, or available coverage. Some operations answer with a status and reason instead of an error when the request is valid but the asset cannot support the result, such as a mindshare forecast for an asset with too little history. Do not replace missing data with invented zeros or retry the same invalid request indefinitely. Check the documented status and message, the resolved identity, units, and scope, then adjust the request or report a reproducible issue.
Reading metrics together
Scope and coverage are part of a metric’s meaning.
Measurement Window
The period used to calculate a point differs from the range displayed on a chart. A seven-day Mindshare chart contains rolling 24-hour readings across seven days; a sentiment chart also uses a 24-hour decay window. Fear & Greed combines several horizons. Bucket size controls how observations are grouped, while sentiment timeframe labels describe an author’s outlook. Compare readings with the same window, market, and filters.
Coverage and Missing Data
Nebula measures its tracked public conversation, not every investor’s opinion or every post on the internet. Source coverage, model classification, bot filtering, and missing history affect readings. No returned data does not establish neutrality or zero interest. A Mindshare calculation can return zero when its denominator is zero, and a sentiment series can have gaps when its trailing window has no posts. Check counts and timestamps before interpreting a quiet or missing series. 4chan coverage is limited to /biz/ and /g/. Analyzed posts with resolved subjects can appear in general and subject feeds. Author, cohort, follower, and caller filters require identifiable authors, so they do not treat anonymous 4chan posts as accounts or callers. Collecting a post does not prove that its analysis has completed or that it is financially relevant.
Clusters / Cohorts
Groups used to compare who is speaking: builders, analysts, traders, institutions, influence accounts, and other roles or behaviours. Author clusters are inferred classifications and can overlap; an account may be both a founder and a developer. They are not verified credentials or endorsements. Smart Money, Dumb Money, and Top Degens are separate caller-ranking segments. r/wallstreetbets is a posting community rather than an author identity. Metric endpoints differ in which groups they accept; never assume that every filter supports communities.
Cluster Overlap
One author can belong to several groups. Selected author clusters are added together for sentiment and Mindshare, so an author classified into two selected groups can contribute to both. Cluster comparisons are not mutually exclusive slices of the population. Do not sum groups to claim a unique audience or treat agreement between overlapping groups as independent evidence.
Builder clusters
Accounts associated with creating and maintaining products.
Developers
Engineers and contributors building or maintaining products and technical infrastructure. Compare developers’ conversation with trader groups to see whether attention centres on implementation, technical risks, or price expectations. This is an inferred account role, not certification of technical expertise or proof that the author contributes to every stock they discuss.
Founders
Founders and co-founders of businesses or projects. The label describes a role, not the quality of their market predictions. Their posts can provide product and business context while also reflecting promotional incentives. Read official announcements separately from personal opinions; being a founder of one venture does not establish insider knowledge about another stock.
Team Leaders
Core team leads and senior figures involved in operating a business or project. Their discussion can be useful for operational context and organisational changes. The classification does not confirm current employment, decision authority, or access to non-public information for every statement.
Project Accounts
Official accounts representing products or projects rather than an individual commentator. Use this group to inspect announcements and official communication, then verify the specific source account. An official tone or a project-account label does not turn forecasts, roadmaps, or marketing claims into completed outcomes.
Institutional clusters
Organisations and accounts associated with investment and market infrastructure.
VCs
Venture funds and early-stage investors. Their discussion can reflect portfolio exposure or investment interests. Compare their attention with other institutions and operating teams to understand which sectors attract discussion. The label does not disclose a fund’s portfolio, position size, investment horizon, or whether a particular deal has closed.
Asset Managers
Funds and asset-management accounts. The classification describes the account; it does not verify holdings or assets under management. Use the group to compare institutional-style discussion with retail-facing commentary, while checking the underlying account and source. A labelled account’s post is not a regulatory holdings disclosure or evidence that its fund traded the asset.
Incubators
Incubators and accelerators supporting new businesses and projects. Discussion can centre on cohorts, launches, grants, or fundraising. Support for a project does not establish ownership, completed funding, or future commercial success; verify the actual arrangement described in the source.
Exchanges
Accounts representing trading exchanges and venues. Posts can include operational updates, listings, and market commentary. Operational notices should be read for the exact instrument, venue, and effective time. A venue’s announcement is not a promise that every Nebula user can trade there or that Nebula supplies execution services.
Influence and media clusters
Who publishes, amplifies, or promotes market discussion.
KOLs
Key opinion leaders: accounts with an influential market audience. Reach is not a verified record of accurate calls or investment expertise. Use this group to examine which influential voices amplify a stock or narrative, then inspect their original posts and recorded calls. The group’s attention is distinct from independently verified investor demand.
Celebrities
Public figures with recognition beyond specialist market commentary. Attention does not establish financial expertise. Their posts can drive attention through reach rather than detailed research. Compare post volume and sentiment with the source context; a mention is not necessarily a directional call, endorsement, or actual investment.
Media
News outlets and publication accounts. Their activity can reflect reporting rather than a personal bullish or bearish position. Compare media activity with direct participant commentary to separate news coverage from reactions. Repetition across outlets can trace back to one source, so a larger count is not automatically independent confirmation.
Marketers
Growth and marketing accounts promoting products or projects. Read their commentary with those incentives in mind. This group helps identify promotional participation within a discussion. Promotion and factual product information can coexist; assess the claim’s source and evidence rather than treating the classification as proof that every post is false.
Shillers
Accounts classified as aggressively promotional or hype-driven. This is a behavioural label, not proof of fraud or paid promotion. Use it as context for the style and incentives of amplification, then read the actual post. The classification is inferred, can overlap other roles, and should not be substituted for source verification.
Analyst clusters
Different approaches to researching stocks and markets.
TA Analysts
Technical analysts interpreting charts, price action, and trading patterns. TA means technical analysis. Compare chart-driven commentary with fundamental or macro groups when their sentiment diverges. A discussed support level or chart pattern is a research interpretation, not a guaranteed future reaction or an executed order.
FA Analysts
Fundamental analysts examining economic value, business performance, and underlying drivers. FA means fundamental analysis. Their discussion may focus on earnings, cash flows, valuation, or industry economics. The label identifies a research approach rather than validating the assumptions, calculations, or conclusion in any particular post.
Macro Analysts
Analysts focused on rates, liquidity, economic policy, and broader market conditions. Their stance can concern economy-wide conditions rather than an individual stock’s near-term outlook. Align the stated horizon and subject before comparing their aggregate sentiment with short-term trader groups.
Investigators
Research accounts investigating suspicious activity or questionable claims, including blockchain investigations where relevant. The label does not validate every allegation. Use source links to distinguish documented findings from allegations and open questions. The presence of investigative discussion can raise attention without establishing liability, fraud, or the outcome of an investigation.
Trader clusters
Trading styles grouped by their typical holding horizon.
Position Traders
Traders discussing positions typically held for weeks or months. The account’s style differs from a specific post’s timeframe label. Compare this group with day and swing traders to understand horizon differences. Its classification describes the account’s observed style, not a verified open position or the horizon of every individual post.
Swing Traders
Traders focused on moves across several days. A cluster describes typical behaviour, not a guaranteed holding period. Their stance may reflect a multi-day setup rather than a view on long-term business value. Inspect extracted calls and their timestamps before comparing outcomes with a different holding horizon.
Day Traders
Traders focused on intraday moves and short-term volatility. Their posts do not establish that a trade was executed. Fast changes in this group’s sentiment can reflect short-term setups or intraday reactions. Compare like-for-like windows; a bearish intraday post does not automatically contradict a bullish long-term thesis.
Behaviour and bias clusters
Recurring communication patterns, not predictions of future performance.
Perma Bulls
Accounts classified as persistently bullish across market conditions. This describes a recurring stance, not a recommendation. A consistently positive baseline matters when assessing whether today’s tone is unusual. Inspect changes in evidence and attention instead of treating routine optimism as a new independent signal.
Doomers
Accounts classified as persistently bearish or focused on adverse outcomes. Their classification does not make those outcomes inevitable. A persistently negative baseline can make a bearish reading less unusual for this group than for the wider market. Read specific claims and catalysts rather than treating the label as a validated prediction.
Tribalists
Accounts showing strong, persistent loyalty to an asset or community. Strong affiliation can affect how they interpret evidence. Compare the group with less affiliated participants to understand how loyalty shapes the discussion. Persistent positivity during falling prices can provide context for Conviction Index, but cluster membership is not itself that metric.
Caller-ranking clusters
Performance-related segments are distinct from role-based author labels.
Smart Money
Nebula’s top-caller segment: accounts selected by its caller rankings for their historical calls. It is not a synonym for institutions, insider information, verified holdings, or on-chain wallet flows. Membership can change as rankings change. Past measured performance does not guarantee the next call will be right. Selection uses dated call history and eligibility rules rather than a permanently fixed list. The current model and formula-based selection paths are described in Caller Rankings and Eligibility; neither makes Smart Money equivalent to a verified institutional portfolio. To research the group, compare its sentiment or share of attention for the same stock and period, then inspect the calls behind the activity.
Dumb Money
Nebula’s bottom-caller segment, based on its recorded call rankings. It is a product label for historical performance, not a claim about a person’s intelligence. The opposite of one of these calls is not automatically a profitable trade. The list is evaluated against recorded call outcomes and may change with each dated ranking. Smart Money and Dumb Money are reconciled to avoid contradictory membership within the same snapshot, but either group can overlap with role-based clusters such as Developers. Compare the effective date and available evidence rather than assuming that the label is permanent.
Top Degens
Top Degens is Nebula’s top segment for calls in the smaller-cap crypto universe, distinct from the broad caller lists used for Smart Money and Dumb Money. It is not a group of stock day traders or a universal high-risk ranking across all markets. The current universe is defined relative to the tracked top-500 crypto market-cap set. Read the effective date and actual membership before making a current claim. The label does not establish verified holdings, realised profits, or the risk tolerance of every account.
Timing clusters
Segments ranked by when accounts join an asset's attention spikes, rather than by who they are or how their calls performed.
Early Movers
Early Movers is Nebula’s timing segment: the accounts that most consistently start talking about an asset as its attention begins to spike. It is rebuilt daily from the last 90 days of mindshare spikes. In each spike, an account’s first mention of the asset, counted only if it had not mentioned the asset in the previous 14 days, is ranked against everyone else who joined; the 300 accounts with the earliest average rank across at least five spikes form the list. It measures timing, not call accuracy or returns, so arriving early does not mean an account was right about the price. Posts are matched to the list as it stood on the day they were written. Use it to see where attention is starting to build: when Early Movers begin discussing a stock, its share of attention has tended to grow over the following days.
Late Movers
Late Movers is the opposite end of the same timing ranking: the 300 accounts that most consistently first talk about an asset at the peak of its attention or as it fades. The label describes when an account usually joins a conversation, not its intelligence or the quality of its calls. When Late Movers pile into an asset, its attention has tended to stall over the following week; treat that as an attention signal, not a price forecast. Membership is rebuilt daily, matched to posts by date, and an account cannot be in Early Movers and Late Movers on the same day.
Other author clusters
Additional account roles and posting behaviours.
Policy / Political
Accounts focused on policy, regulation, politics, and their market implications. This account classification differs from a political or regulatory event tag on a story. A person may discuss a policy event without being classified in this group, and a classified account can discuss non-political subjects.
Bots
Accounts classified as automated bots. Unfiltered sentiment and Mindshare exclude bots from their main measurements; other views may expose a bot cohort or have their own filtering rules. A bot cohort can help examine automated amplification separately from the main human-oriented reading. Bot labels are classifications rather than proof that every post is spam; use the metric’s explicit inclusion policy.
Automated / AI
Accounts associated with AI agents or automated publishing. This label is distinct from the Bots cluster; do not assume identical membership or exclusions. Use the group to understand automated participation without equating model-generated content with verified research. Overlap and filtering depend on the view, so check the relevant cohort rather than assuming every automated account was removed.
Posting communities
Communities are defined by where posts appear.
r/wallstreetbets
Stock discussion posted in r/wallstreetbets. This community is scoped by posting location, not by assigning each author a permanent identity. Its activity, sentiment, authors, and stock attention include posts and comments. Community support is specific to each view: author-cluster Mindshare and Social Momentum endpoints do not accept this community filter. Compare it with account-based cohorts only after aligning the source and time window. An author’s activity elsewhere is not automatically part of this community’s data.
Crypto-specific clusters
Definitions for explicitly crypto-specific research workflows.
DAO / Guild Funds
Decentralised organisations, guilds, and collective treasury accounts. The label does not disclose or verify their current holdings. Use the group for crypto-specific institutional and community treasury discussion. Governance proposals and stated allocations are different from executed transfers, and the account label does not verify the assets controlled.
On-chain Analysts
Analysts interpreting blockchain activity and wallet data. This account classification is not itself an on-chain flow metric. The analysis can discuss transfers, addresses, flows, and protocol activity, but those claims still require inspection of their evidence. It does not mean the Nebula agent has direct access to every address or transaction.
NFT
Accounts and communities focused on non-fungible tokens and related collecting activity. Discussion can concern collecting, marketplaces, community activity, or token mechanics. Attention and sentiment in this group are not a floor-price series or a measure of realised trading liquidity.
Stock market terms
Stock-specific language for attention, stance, and catalysts.
Stock Sentiment
The aggregate stance of public conversation about a stock or ticker. It is most useful when scoped to a clear time window and read alongside earnings, filings, news, price action, and the sources driving the change. Nebula’s sentiment chart uses the signed signal explained in Social Sentiment.
Fear & Greed scoped to one stock, using Nebula’s composite market and social inputs. It shares the 0–100 scale and bands described in Fear & Greed; it is not an earnings forecast, valuation, or probability of a price rise. Available history and inputs determine coverage.
The short symbol used to identify a publicly traded security, such as NVDA for NVIDIA. The same company can have different symbols across exchanges, so a reliable research workflow also checks the company name and listing venue.
Catalyst
An event or development capable of changing expectations for a company, sector, or asset. Earnings, product launches, regulation, analyst actions, management changes, and macroeconomic releases can all become market catalysts.
Bullish and Bearish Stocks
A ranking of stocks by the positive or negative tone of their tracked conversation. These lists help researchers find unusual shifts, but strong sentiment is a starting point for investigation rather than a recommendation to buy or sell.
Language for market-wide emotion, token attention, and crypto-native participants.
Crypto Fear & Greed Index
A Fear & Greed reading in a crypto-specific workflow. Check the instrument and scope: a Bitcoin-specific score does not measure every crypto asset. Nebula’s score uses its own composite model and is not interchangeable with another provider’s index. The 0–100 score describes conditions, not the probability of a return.
A market-wide measure of whether tracked crypto conversation is leaning bullish, bearish, or neutral. It measures public mood rather than price direction and can diverge from the market during fast-moving events.
A market regime in which a broad group of crypto assets outside Bitcoin gains relative participation or attention. Definitions vary, so every index should state its universe, methodology, thresholds, and measurement window.
A key opinion leader whose analysis, commentary, or audience can influence crypto attention. Reach alone does not establish expertise; source quality, conflicts, historical calls, and the accounts amplifying a narrative all matter.
Relative Market Capitalisation
In crypto-specific views, relative market capitalisation compares an asset’s market cap with the named benchmark, such as Bitcoin, and expresses the ratio as a percentage. It measures relative size under the supplied market-cap data, not social Mindshare, trading volume, or the probability of outperformance. Check the numerator and denominator shown by the selected pair: reversing them changes the ratio. Missing or inconsistent supply and price data can affect market-cap comparisons.
Prediction market terms
The mechanics needed to interpret event-contract prices responsibly.
Prediction Market
A market where participants trade contracts tied to the outcome of a future event. Prices often resemble probabilities, but fees, liquidity, participant mix, contract rules, and market access can all affect that interpretation.
Event Contract
A contract that settles according to whether a defined event occurs. Its wording, deadline, data source, and resolution rules determine what traders are actually pricing, so the title alone is never enough.
Market-Implied Probability
The probability suggested by a contract’s current price after accounting for its payout structure. It reflects the market’s aggregate position at that moment, not an objective forecast or a guarantee that the event will occur.
Resolution Criteria
The written rules used to determine a prediction market’s final outcome. Good criteria identify the authoritative source, cutoff time, exceptional cases, and how ambiguous or delayed results will be handled.
Calibration
The relationship between forecast probabilities and observed outcomes over many predictions. A well-calibrated forecaster should be correct roughly 70 percent of the time when repeatedly assigning a 70 percent probability.
Stock and market event tags
Content categories used to filter Intelligence. A tag describes subject matter, not verification, significance, or a prediction.
Acquisition (event tag)
A proposed or completed purchase of a business or assets. Distinguish initial interest, a signed agreement, regulatory approval, and completion; those stages can generate separate stories with different uncertainty.
Analyst Rating (event tag)
A broker or research analyst’s published recommendation, rating change, or price-target update. It reflects that analyst’s view and assumptions, not a Nebula recommendation or a guaranteed future price.
Buyback (event tag)
A business’s share-repurchase programme or related repurchase activity. An authorisation is permission to repurchase and need not equal completed purchases. Interpret it with the programme’s amount, timing, and execution disclosures.
Capital Expenditure (event tag)
Spending on long-lived assets or infrastructure, such as factories, data centres, or equipment. Announced plans, committed projects, and recognised spending differ. The tag identifies investment activity rather than proving its eventual return.
Central Bank (event tag)
A central-bank announcement, decision, speech, or action. Rates, asset purchases, liquidity facilities, and policy guidance can affect market expectations. Check whether the story reports an actual decision or commentary about a possible future one.
Commodity Demand (event tag)
A development affecting consumption or expected demand for a commodity. Demand forecasts, reported consumption, and commentary have different evidential weight; a tag does not establish the size or certainty of the resulting price effect.
Commodity Supply (event tag)
A development affecting commodity availability, production, exports, or supply constraints. Reported disruption, projected capacity, and actual output should be distinguished. Supply changes can interact with inventories and demand.
Corporate Action (event tag)
An issuer action affecting securities or shareholder rights, such as a split, rights issue, or reorganisation. Check effective dates and the precise security involved. A corporate action can change quoted prices without representing the same economic move as a normal trading-day return.
Cybersecurity (event tag)
A security-related development involving systems, data, or access. Distinguish a vulnerability report, suspected incident, confirmed breach, and remediation. Tagging the subject does not validate every allegation or establish financial impact.
Debt Financing (event tag)
Borrowing or issuance of debt, including bonds and credit facilities. An arrangement, commitment, drawdown, and refinancing are different events. Read the disclosed terms and purpose before interpreting the implications for a stock.
Delisting (event tag)
Removal or planned removal of an instrument from a listing or trading venue. Scope matters: a venue-specific removal need not mean the instrument stops trading everywhere. Check the notice, effective date, and applicable instrument.
Dividend (event tag)
A cash or other distribution announced or paid to shareholders. Declaration, ex-dividend, record, and payment dates serve different purposes. A reported dividend or historical yield does not guarantee future distributions.
Earnings (event tag)
Reported or scheduled financial results, often including revenue, profit, margins, and management commentary. A calendar entry for earnings is different from a released result. Compare the reporting period and actual figures with the expectations being discussed.
Economic Release (event tag)
A scheduled or published economic data release, such as inflation, employment, or activity figures. Initial releases can be revised; the reported period, publication time, and comparison with expectations matter.
Election (event tag)
An election-related development, including campaigns, polling, voting, and declared results. Polls, forecasts, and official outcomes differ. The tag indicates political-event coverage rather than a verified probability or final result.
Employment (event tag)
Labour-market data or employment developments such as hiring, unemployment, wages, or layoffs. Distinguish economy-wide statistics from an individual business’s workforce announcement and check the period covered.
ETF (event tag)
An exchange-traded fund or a development involving its structure, launch, approval, or trading. An ETF is a market instrument rather than direct ownership of every underlying asset by the reader. Check the particular fund and event.
Expert Analysis (event tag)
Analysis or interpretation attributed to a specialist or expert source. It is an opinion or research contribution to evaluate, not a guarantee of expertise, independence, or correctness merely because the item carries this tag.
Fiscal Policy (event tag)
Government taxation, spending, budgets, and related financing policy. Proposals, legislation, and implemented measures have different statuses; distinguish them before inferring the effect on stocks or growth.
Fundraising (event tag)
An effort or completed transaction to raise capital for a business or project. A funding discussion, announced round, and confirmed proceeds are not interchangeable, and the disclosed terms determine what the announcement means.
Guidance (event tag)
Management’s stated expectations for future business performance. Guidance can be issued, raised, lowered, withdrawn, or reiterated. It is forward-looking information with assumptions, not a realised earnings result or a Nebula forecast.
Hack (event tag)
A reported unauthorised compromise of a system or account. Distinguish suspected access, confirmed compromise, estimated damage, and recovery. The presence of the tag does not authenticate an accusation or a stated loss amount.
Inflation (event tag)
Changes in prices or inflation expectations, including published measures and policy discussion. A monthly change, annual rate, and forecast are different quantities. Check the economy, index, period, and release status.
Inventory Report (event tag)
A report about stored quantities of goods or commodities. Changes in inventories can provide supply-and-demand context, but the reporting interval, expected change, and coverage of the measurement matter.
IPO (event tag)
An initial public offering or associated listing process. A filing, proposed valuation, priced offer, and first trading day are different milestones. Discussion of a potential IPO does not establish that a tradable listed instrument already exists.
Launch (event tag)
The announcement or release of a product, service, or initiative. Separate a future launch date from actual availability, adoption, or revenue. The tag identifies the event category rather than the product’s eventual success.
Legal (event tag)
Litigation, court decisions, legal claims, or other legal proceedings. Allegations, filings, rulings, appeals, and final outcomes should be distinguished. The tag is not a legal conclusion about the parties involved.
Listing (event tag)
The addition or planned addition of an instrument to a trading venue. Check which venue and instrument are involved and when trading becomes available. A listing announcement does not imply universal exchange access or complete Nebula price history.
Macroeconomic (event tag)
A broad economic or cross-market development involving growth, policy, liquidity, or other economy-level forces. The label describes scope; it does not supply a single metric, mechanism, or predicted market direction.
Monetary Policy (event tag)
Central-bank actions and guidance concerning interest rates, money, and financial conditions. It is distinct from fiscal policy, which concerns government taxing and spending. Separate an actual decision from market expectations.
Outage (event tag)
A disruption to a service, system, or infrastructure. A partial degradation, full interruption, and completed recovery can have different implications. Check the affected scope and time rather than assuming every user or business unit was affected.
Partnership (event tag)
A reported collaboration or commercial relationship. A memorandum, pilot, distribution agreement, and material revenue-generating contract are not equivalent; inspect what the parties actually confirmed.
Political (event tag)
A political development, statement, or policy-related event. It is a story category distinct from Nebula’s Policy / Political author cluster, which classifies accounts. A post can discuss politics without its author belonging to that cluster.
Price Event (event tag)
A notable price-related development such as a sharp move or a discussed level. It is different from a verified cause of that move and from the continuous price-history series. Check the instrument, observation time, and comparison period.
Product Update (event tag)
A change to an existing product or service. A roadmap item, announced feature, and shipped capability differ. Product news can attract attention without proving a financial impact.
Production Change (event tag)
A change in physical output, capacity, or production plans. Actual production, planned capacity, and a temporary disruption differ. Interpret the change alongside demand, inventories, and the affected period.
Regulatory (event tag)
A regulatory proposal, investigation, approval, enforcement action, or rule change. Jurisdiction and status matter: consultation is not final law, and an application is not approval. Read the underlying announcement.
Research (event tag)
A study, report, or substantive research contribution. The tag identifies material for analysis rather than validating the method or conclusion. Check the author, evidence, assumptions, and publication date.
Rumor (event tag)
An unconfirmed claim or report circulating in discussion. Nebula may surface it because it attracts attention, not because it is verified. Distinguish repetition from independent confirmation and inspect the original source before treating it as fact.
SEC Filing (event tag)
A filing submitted to the US Securities and Exchange Commission. The filing type, reporting period, amendments, and actual contents determine its meaning. The existence of a filing does not mean the SEC endorses the issuer or every statement.
Speculation (event tag)
A conjecture, scenario, or prediction that goes beyond established facts. It can be useful for understanding expectations, but it should be kept separate from confirmed events and measured observations.
Team Activity (event tag)
An update involving a project’s team, leadership, or contributors. A departure, appointment, or public statement can affect attention, but the tag does not establish the magnitude of a business or price impact.
Trade Policy (event tag)
Government rules affecting international trade, such as tariffs, restrictions, agreements, or export controls. Proposals, announcements, effective dates, and exemptions can materially change the scope of an event.
Crypto-specific event tags
Content categories for explicitly crypto-specific research. Read event status and source evidence alongside the tag.
Airdrop (event tag)
A distribution of crypto tokens to eligible recipients. Eligibility, claim deadlines, and conditions vary; a post tagged as an airdrop is not a verified entitlement or an instruction to connect a wallet.
Burn (event tag)
A crypto-specific event that removes tokens from circulation under the relevant mechanism. A reported burn does not by itself establish a lasting reduction in effective supply or a positive price effect.
Exploit (event tag)
A reported use of a technical weakness to produce unintended behaviour, especially in crypto or software systems. A possible exploit, a confirmed incident, and quantified losses are separate claims that require evidence.
Fork (event tag)
A crypto-specific change that splits or changes a blockchain’s rules or history. A planned network fork and an actual chain split are different events. Read the relevant network, activation conditions, and compatibility details.
Governance (event tag)
A decision-making process, proposal, or vote about the rules or operation of a project or organisation. A proposal need not pass or be implemented, so check its status and the relevant decision authority.
ICO (event tag)
An initial coin offering or similar crypto-specific token fundraising event. Announced sale terms, eligibility, completion, and subsequent trading are separate stages. The tag is a content category, not an endorsement of the offering.
Mainnet (event tag)
A crypto-specific network’s production environment or its launch. Production deployment differs from a test network, and launch does not by itself establish adoption, reliability, or economic value.
Mint (event tag)
Creation or issuance of tokens or non-fungible tokens in a crypto-specific workflow. Minting activity, an announcement of a future mint, and secondary-market demand are different measures.
Staking (event tag)
A crypto-specific activity involving committed tokens under a network or protocol’s mechanism. Announced rewards, realised rewards, lockups, and associated risks differ; a staking tag is not a verified yield offer.
Testnet (event tag)
A testing environment for a blockchain or protocol. A testnet launch or result is distinct from production deployment, and test activity does not automatically imply real economic transactions or reliable mainnet performance.
Token Unlock (event tag)
A scheduled or actual release of previously restricted crypto tokens. The amount, recipients, vesting rules, and circulating-supply treatment matter. An unlock does not prove that released tokens will immediately be sold.
Tokenization (event tag)
Representation of assets or rights using tokens in a digital system. The legal rights, custody, transfer rules, and underlying asset differ by implementation. A tokenization announcement does not establish ownership or liquidity for every participant.
Tokenomics (event tag)
The design of a crypto token’s supply, issuance, allocation, incentives, and use. Proposed changes, implemented rules, and observed behaviour should be distinguished. Tokenomics is not a single Nebula score.
Upgrade (event tag)
A technical or operational change to an existing system, including protocol upgrades in crypto-specific coverage. Scheduled activation, completed deployment, and observed effects differ; a tag does not guarantee a successful rollout.
Whale (event tag)
A reported movement associated with a large holder or transaction in crypto-specific coverage. A transfer is not automatically a purchase or sale, and the tag does not verify wallet ownership or grant Nebula’s agent a live on-chain holdings tool.
Event-market and sports tags
Content categories that can appear in broader subject and event coverage. They do not imply a tradable stock or a completed market resolution.
Injury (event tag)
An injury-related development in event or sports coverage. Availability reports, confirmed diagnoses, and expected return dates have different certainty. Its presence in topic or event coverage does not make it a stock-market metric.
Market Resolution (event tag)
The determination of an event market’s settlement outcome under its published rules. A likely outcome, provisional report, and final resolution are different states. Read the authoritative source and resolution criteria.
Odds Movement (event tag)
A change in the price or implied probability of an event outcome. The contract’s payout structure, liquidity, and rules affect interpretation. A movement in odds is not necessarily new verified information or an objective probability change.
Sports Result (event tag)
An outcome reported in sports or event-market coverage. A live score, provisional result, and final official result are different states, especially when a contract’s resolution rules specify a particular source.
Sports Transfer (event tag)
A reported or proposed movement of a player between teams. Negotiations, agreement, registration, and official confirmation are different milestones. This is an event-content category, not a stock metric.
Put the definitions to work with live market data.