
Social sentiment becomes useful for stock research when it changes your process, not when it replaces it. The goal is to detect a meaningful shift in attention, identify the claim driving it, verify that claim against primary evidence, and decide whether price and expectations already reflect it. This guide turns that idea into a repeatable workflow for any public company.
The workflow
Discover the attention change, separate tone from volume, find the catalyst, rank source quality, verify the facts, compare sentiment with price and valuation, then write both the thesis and the disconfirming case. Social data narrows the search; primary research decides what the signal means.
The right role for social sentiment
Investors often ask whether sentiment predicts stock prices. That question is too broad to guide a real workflow. A more productive question is: what research job can this signal perform? Social sentiment can help with discovery, event monitoring, expectation tracking, source disagreement, and crowding. Each job has a different success criterion.
For discovery, success means finding an important company or catalyst earlier than your normal watchlist process. For event monitoring, it means noticing which part of an earnings release the market cares about. For crowding, it means identifying when a popular thesis has become one-sided. None of those requires the score to predict tomorrow's close perfectly.
FINRA's work on social-media-influenced investing describes sentiment as alternative data used to supplement traditional analysis. It also records the central risks: low-quality data, misleading claims, conflicts, manipulation, and emotionally driven decisions. Build the workflow so those warnings are handled at every step.
Step 1: discover a real change in attention
Start with movement, not a static popularity list. The most discussed stocks are often the same large or speculative names every day. A change in share of conversation is more likely to point to new information. On Nebula's stock mindshare leaderboard, compare the current share with the 24-hour change and post count.
Apply a minimum activity threshold. A ticker whose sentiment jumps because three posts replaced one post is not comparable with a company discussed by hundreds of independent accounts. Check whether the change appears across several source types or comes from repeated copies of one message.
At this stage, write a neutral observation rather than a thesis: “Company X's share of equity discussion doubled after 14:00 UTC, with most new posts focused on gross margin.” Avoid writing “The market knows margins will beat.” The first statement describes data; the second smuggles in a conclusion.
Step 2: separate attention, tone, and emotion
Attention asks how much discussion a stock receives. Sentiment asks whether the relevant language is bullish, bearish, or mixed. Emotion asks whether the conversation communicates confidence, fear, anger, surprise, urgency, or uncertainty. These signals often diverge.
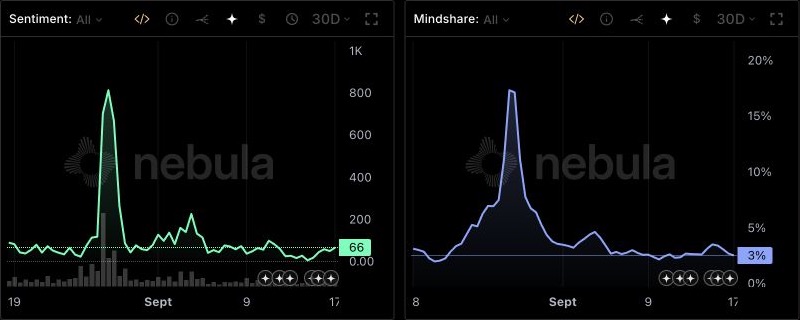
NVIDIA in Nebula: Sentiment describes directional tone; Mindshare measures the share of tracked conversation. The charts use different scales. Captured on 17 September 2026; these are historical readings. Open the live NVIDIA profile.
- Rising attention plus improving tone can indicate a constructive catalyst, but can also become crowded after a large price move.
- Rising attention plus deteriorating tone often points to a risk event, disappointing disclosure, controversy, or rapid repricing.
- Rising attention plus mixed tone can be especially valuable because disagreement creates testable questions.
- Falling attention with extreme tone may mean the loudest participants remain while the broader market has moved on.
Use the ticker sentiment tool to examine the series rather than a single current number. Note when the move began, whether it persisted, and whether the stock's Fear & Greed reading agrees. Then open the bullish and bearish stocks leaderboard to see whether the reading is extreme relative to other active names.
Step 3: identify the catalyst and exact claim
Do not stop at “earnings” or “AI news.” Identify the specific claim that changed expectations. It might be a revenue guide, unit growth, pricing, margins, backlog, a legal ruling, clinical data, a product delay, financing terms, insider activity, or exposure to a macro event.
Create a claim ledger with four columns: claim, source, publication time, and verification status. If several posts say a contract is worth $5 billion, find the company release, government award, or filing. Determine whether $5 billion is a ceiling, committed value, total programme value, revenue recognised over years, or someone's estimate. Social summaries frequently erase those distinctions.
Timestamping matters. A post published after price moved is an explanation or reaction, not an early signal. A screenshot may recycle an old article. Check the original publication date and whether the information was already public in a filing or call.
Step 4: verify with primary evidence
Move from social discovery to documents. For U.S. public companies, use the SEC's EDGAR system to find 10-K and 10-Q reports, 8-K current reports, registration statements, proxy materials, and insider filings. Investor relations pages can provide the earnings release, prepared remarks, presentation, and webcast transcript. Government agencies and courts may be the primary source for regulatory, contract, or litigation claims.
Read the relevant section rather than relying on a search snippet. Compare the new disclosure with the previous period and management's earlier guidance. A number can beat consensus while deteriorating sequentially, or miss a headline estimate while the underlying unit economics improve. The social conversation tends to compress these nuances into one direction.
Distinguish fact from interpretation. “The company guided revenue to $X–$Y” is a fact. “The guide is conservative” is an interpretation requiring evidence about past guidance behaviour, seasonality, demand, and consensus. Keep both in the notebook, but label them correctly.
Step 5: rank source quality and incentives
Not all posts should receive the same weight. A useful source ladder starts with the company or official record, then established reporting, subject-matter experts, identifiable analysts, investors with a documented process, general commentators, and anonymous promotional accounts. The ladder is contextual: an engineer may understand a technical claim better than a financial journalist, while the journalist may verify corporate facts more reliably.
Check incentives. Does the author own the stock, sell a newsletter, receive issuer compensation, farm engagement, or publish only successful calls? A disclosed position does not invalidate the analysis, but it changes how you weigh it. Look for falsifiable reasoning, links to evidence, corrections, and a track record that includes misses.
Separate independence from repetition. Fifty accounts repeating one unsourced claim are one source event, not fifty confirmations. A good aggregation system should reduce that duplication, but the researcher should still inspect the propagation path when the stakes are material.
Step 6: compare sentiment with price and expectations
A correct observation can still make a poor trade if it is already priced. Mark the stock's return before the sentiment shift, during it, and after the verified information became public. Compare it with the relevant index and sector. Review volume, implied volatility where appropriate, and the next known catalyst.
Then translate the social claim into an expectation. If investors are excited about revenue acceleration, what growth rate does the current valuation require? If they fear margin pressure, what decline is consensus already modelling? Sentiment tells you what people emphasise; valuation tells you how much of that view the price may contain.
Avoid simplistic divergence rules. Improving sentiment with falling price is not automatically bullish—the market may be responding to information the social sample has missed. Negative tone during a price rally is not automatically a short—the sceptics may be anchored to an outdated thesis. Divergence creates a question that needs evidence.
Step 7: write the thesis, risks, and disconfirming case
Summarise the work in a short decision record:
- Observation: what changed in attention and sentiment?
- Catalyst: which event or claim caused the change?
- Verification: which primary sources confirm or contradict it?
- Expectation gap: what does the crowd appear to believe, and what does price imply?
- Time horizon: when should the thesis become testable?
- Disconfirming evidence: what result, disclosure, or price behaviour would show the interpretation is wrong?
- Risk: what position size or decision is consistent with uncertainty?
This record prevents hindsight from rewriting the thesis. If you use sentiment repeatedly, evaluate the process across a sample of decisions. Track whether it improved discovery, reduced reaction time, identified risks, or changed outcomes relative to a benchmark. Do not remember only the spectacular examples.
Worked example: an earnings-driven attention spike
Imagine a software company's mindshare triples after results. Sentiment rises from mixed to strongly bullish while the stock gains 12% after hours. Most posts cite revenue growth and an “AI backlog.” The workflow does not conclude that the stock will keep rising.
First, separate the claims. The earnings release confirms revenue growth; prepared remarks define what management means by backlog; the 10-Q may show contract duration, concentration, and cancellation terms. The call transcript reveals whether analysts challenged conversion timing. Next, compare the guide with consensus and the prior guide. Then ask whether the 12% move already reflects the improvement and whether implied volatility had priced a large move.
Finally, read disagreement. Bears may argue the backlog is non-binding; bulls may cite customer additions and operating leverage. The research value is not the aggregate “bullish” label. It is that the label guided you to the variable the market is repricing and the evidence needed to test both sides.
A compact checklist
- Is attention genuinely rising relative to the stock's own baseline?
- Does tone move across more than one credible source group?
- What exact claim or event explains the change?
- Can the claim be verified in a filing, release, transcript, agency record, or other primary source?
- Did price move before or after the conversation?
- What expectation appears embedded in valuation and consensus?
- What evidence would disprove the interpretation?
- Could promotion, ticker ambiguity, duplication, stale posts, or survivorship distort the signal?
Continue with the specialist workflows for earnings sentiment analysis, market-narrative tracking, and social momentum in stock research. The alternative-data guide explains how to evaluate the wider evidence set before adding a signal to a repeatable process.
Sources and research resources
- SEC EDGAR company filings search
- Investor.gov guide to researching investments
- FINRA report on social-media investing tools
- FINRA investor bulletin on social sentiment
Bottom line
Treat social sentiment as a research router. It can tell you where attention changed, what the crowd thinks matters, and where disagreement is forming. Your edge comes from verifying the claim, understanding expectations, and recording what would prove you wrong—not from following the loudest score.
Where financial attention becomes signal
Explore live social intelligence across stocks and digital assets, or pull Nebula data into your own workflow with the API.